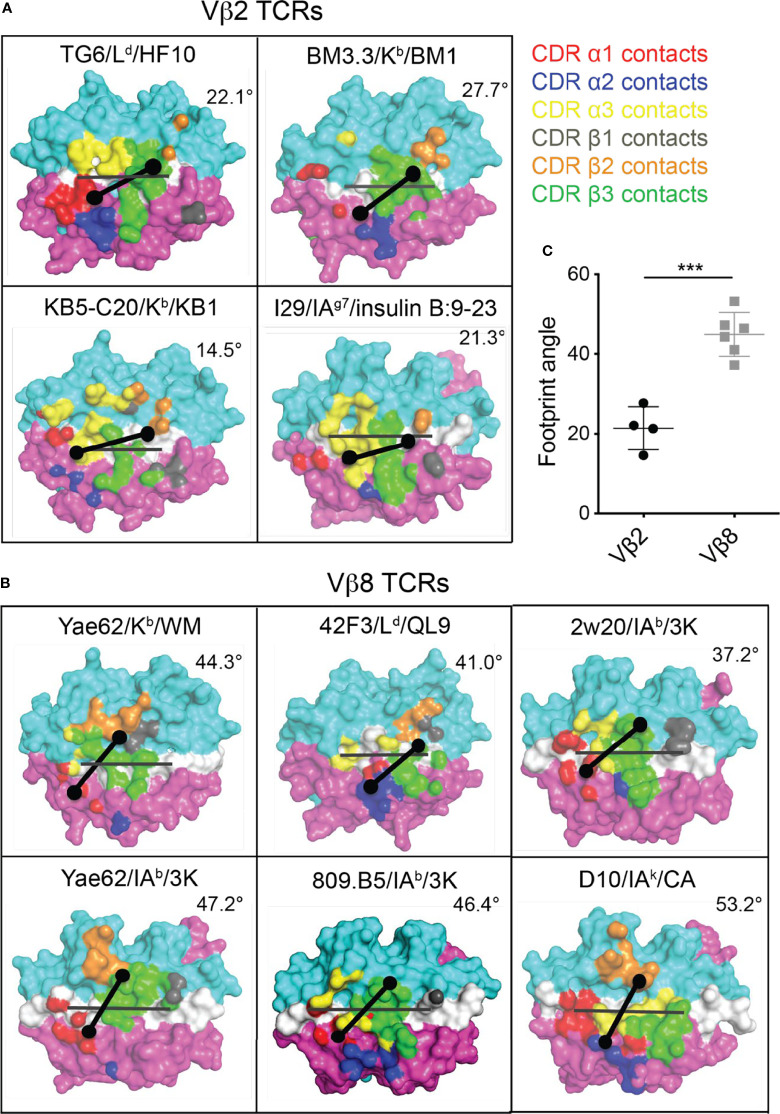
Figure 5.
Footprint for binding of Vβ2 and Vβ8 containing TCRs to pMHC. The TCR footprints for four different Vβ2 TCR/pMHC complexes (A) and six different Vβ8 TCR/pMHC complexes (B) are shown, along with footprint angles, calculated based on a vector for the peptide (grey line) and a vector for the TCR-pMHC contact regions (black line) as described in the text. The center of the TCRα and TCRβ footprints are indicated by dots. Structures are: TG6 TCR binding to Ld-HF10 (PDB: 6X31); BM3.3 TCR binding to Kb-pBM1 (PDB: 1FO0); KB5-C20 TCR binding to Kb-pKB1 (PDB: 1JK2); TCR I29 binding to IAg7-insulin B:9-23 (PDB: 5JZ4); TCR Yae62 binding to Kb-pWM (PDB: 3RGV);TCR 42F3 to Ld-pCPA12 (PDB: 4N5E); TCR 2w20 to IAb-3k (PDB: 3C6L); TCR Yae62 to IAb-3k (PDB: 3C60); TCR ANI2.3 to DR52c-pHIR (PDB: 4H1L); TCR D10 to IAk-pCA (PDB: 1D9K). (C) Summary of all calculated Vβ2 and Vβ8 TCR footprint angles. Statistical significance was determined by a t-test (***p < 0.001).

