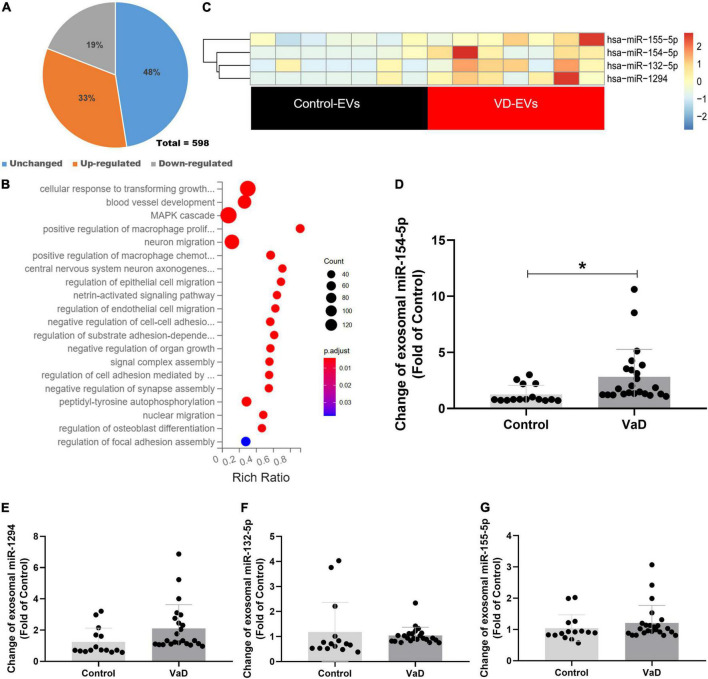
FIGURE 2.
Bioinformatics analysis of miRNAs expression profiles in serum exosomes of patients with VaD. (A) Pie chart of differentially expressed miRNAs. The Jacinth part presented upregulated miRNAs; the gray part indicated downregulated miRNAs; the blue part presented unchanged miRNAs. (B) Heat map of differentially expressed miRNAs from patients with VaD and control group. (C) The KEGG analysis of the pathways enriched by the differentially expressed miRNAs from patients with VaD. (D–G) The upregulated miRNAs were further verified using RT-PCR in patients with VaD and control group (Control: n = 13, VaD: n = 23). *p < 0.05. Data are shown as mean ± SD. KEGG, Kyoto Encyclopedia of Genes and Genomes; RT-PCR, reverse transcription polymerase chain reaction; VaD, vascular dementia.

