FIGURE 3.
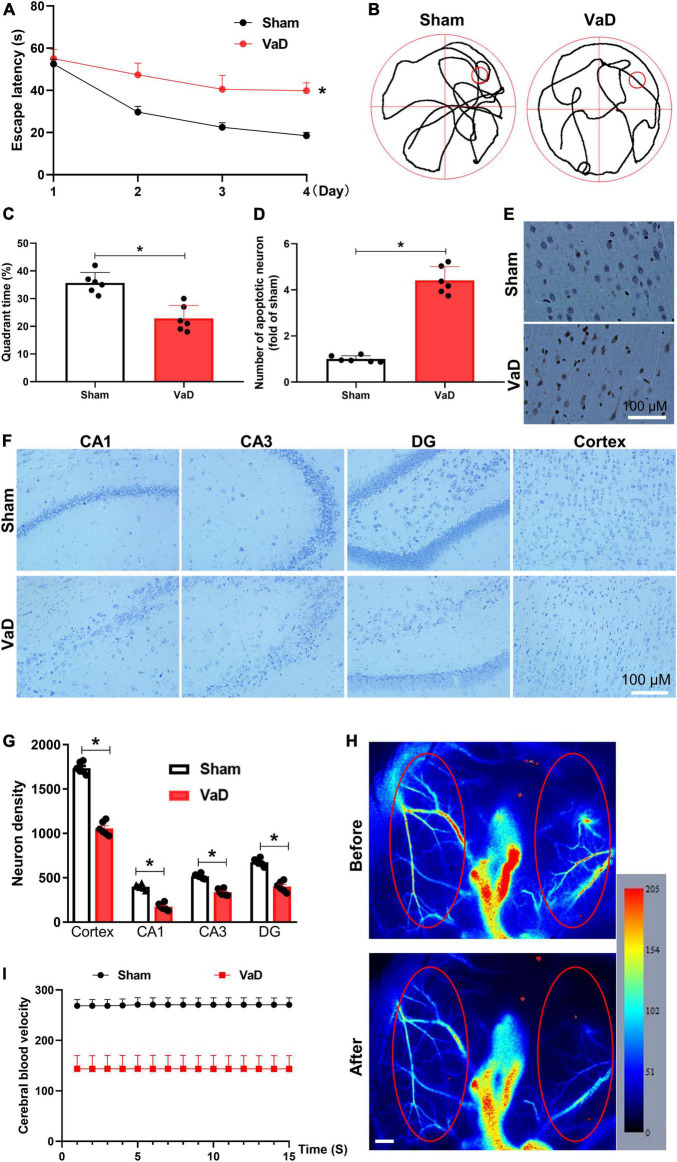
Establishing of VaD rat model. Sprague-Dawley rats were subjected to bilateral common carotid artery occlusion surgery to induce VaD rat model. Three months later, the Morris water maze (MWM) test was performed, then brains were collected for histopathological analysis. (A) The trajectory chart. (B) The latency time of rats to reach a hidden platform from day 1 to day 4 were recorded. (C) The percentage of time spent in the platform quadrant was calculated. (D) The statistical chart for TUNEL-positive cells. (E) Representative images of TUNEL staining in the cortex region. Representative images of Nissl staining in the CA1, CA3, DG, and cortex regions (F), and neuron density (G). (H) Cerebral blood velocity before and after surgery. Red ellipse represents region of interest. Scale bar, 0.5 mm. (I) The cerebral blood velocity was measured in regions of interest. [(A–G): n = 6; (H,I): n = 3]. *p < 0.05. Data are shown as mean ± SD.

