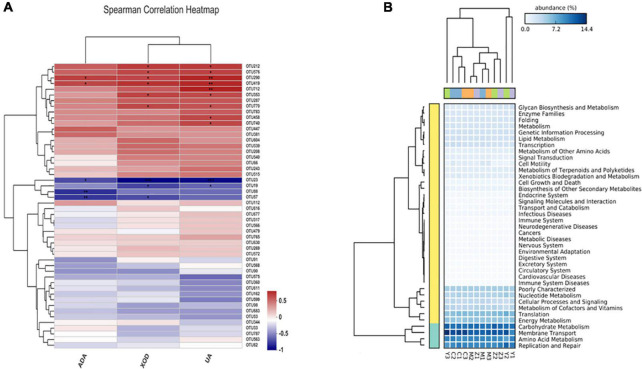
FIGURE 8.
Spearman correlation heatmap and the potential metabolic function of the gut microorganisms in hyperuricemia rats. (A) Spearman correlation heatmap revealed the relationship between hyperuricemia-related indicators and the main microbial community. *p < 0.05; **p < 0.01. (B) The difference of predicted microbial functions in KEGG pathways among groups.

