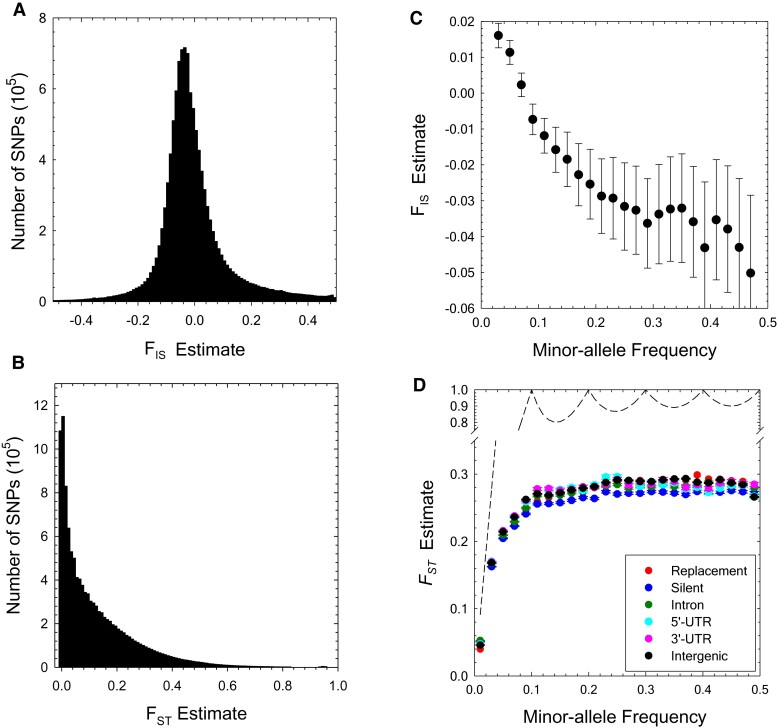
Fig. 2.
(A,B) Genome-wide distributions of the and estimates, shown using bins of width 0.01. The results are based on 11,731,566 SNP sites with significant polymorphisms (determined by the ML allele-frequency estimator, using a 95% confidence cutoff level). The medians of the and estimates are −0.01 and 0.08, respectively. (C) The profile of average with respect to minor-allele frequency (MAF) class (standard errors denoted by the vertical bars), based on polymorphisms with maximum-likelihood MAF estimates significant at the 5% level. (D) The profile of average with respect to minor-allele frequency class (standard errors denoted by the vertical bars); dashed line is the statistical upper bound for obtained using equation (5) of Alcala and Rosenberg (2017).

