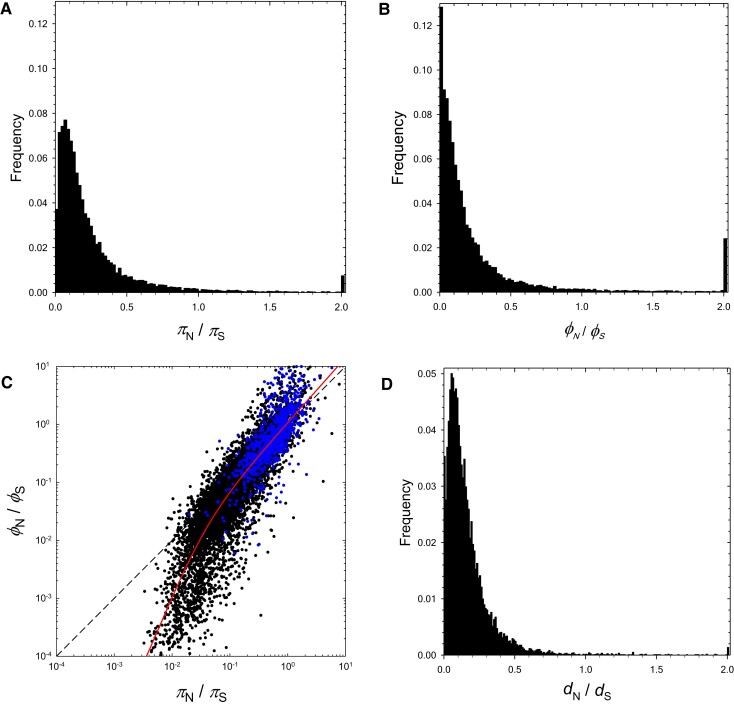
Fig. 6.
Distributions of the within- and among-population ratios and , and the between-species ratio over all protein-coding genes. In (A), (B), and (D), the final peaks to the right are the sums of all ratios exceeding 2.0. In (C), the black and blue points denote, respectively, genes with and without apparent orthologs in the outgroup D. obtusa, and the diagonal dashed line denotes points of equality. The red line is a least-squares fitted function: ; under this model, scales with the 1.79 power of when the latter is small, but with the 1.12 power when the latter is large, with the inflection point between the two scalings falling at .

