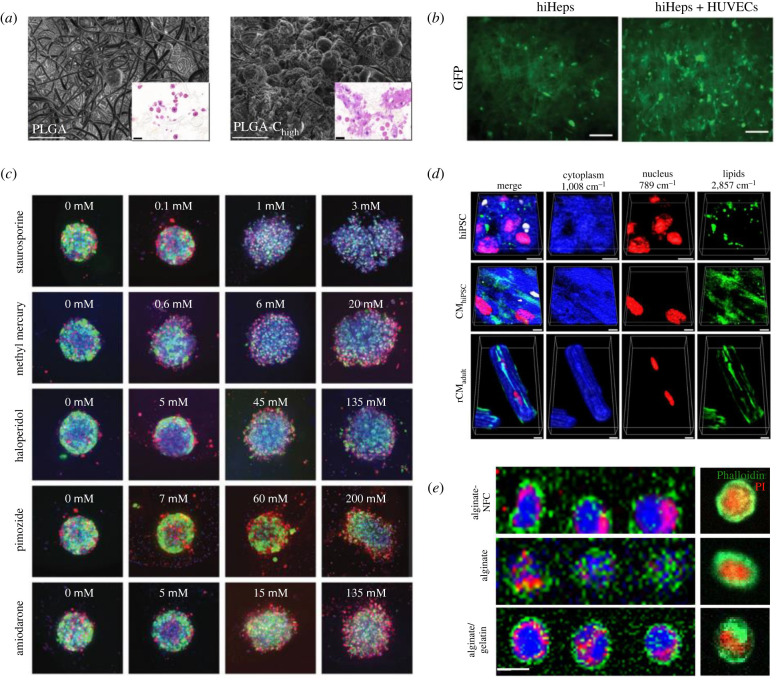
Figure 3.
The varying degrees of imaging in the field. (a) Electron microscope images demonstrating in high detail how cells integrate with the electrospun fibres [61]. (b) Fluorescent imaging shown purely to demonstrate that the cells populate the scaffold and to track growth [106]. (c) Quantitative fluorescent imaging of toxicity in spheroids for different drugs [120]. (d) Volumetric Raman imaging of cells growing in a hydrogel where the researchers were able to quantify the level of different cell components [121]. (e) Raman imaging of spheroids to visualize the distribution of different cell components [122].

