
Figure 3.
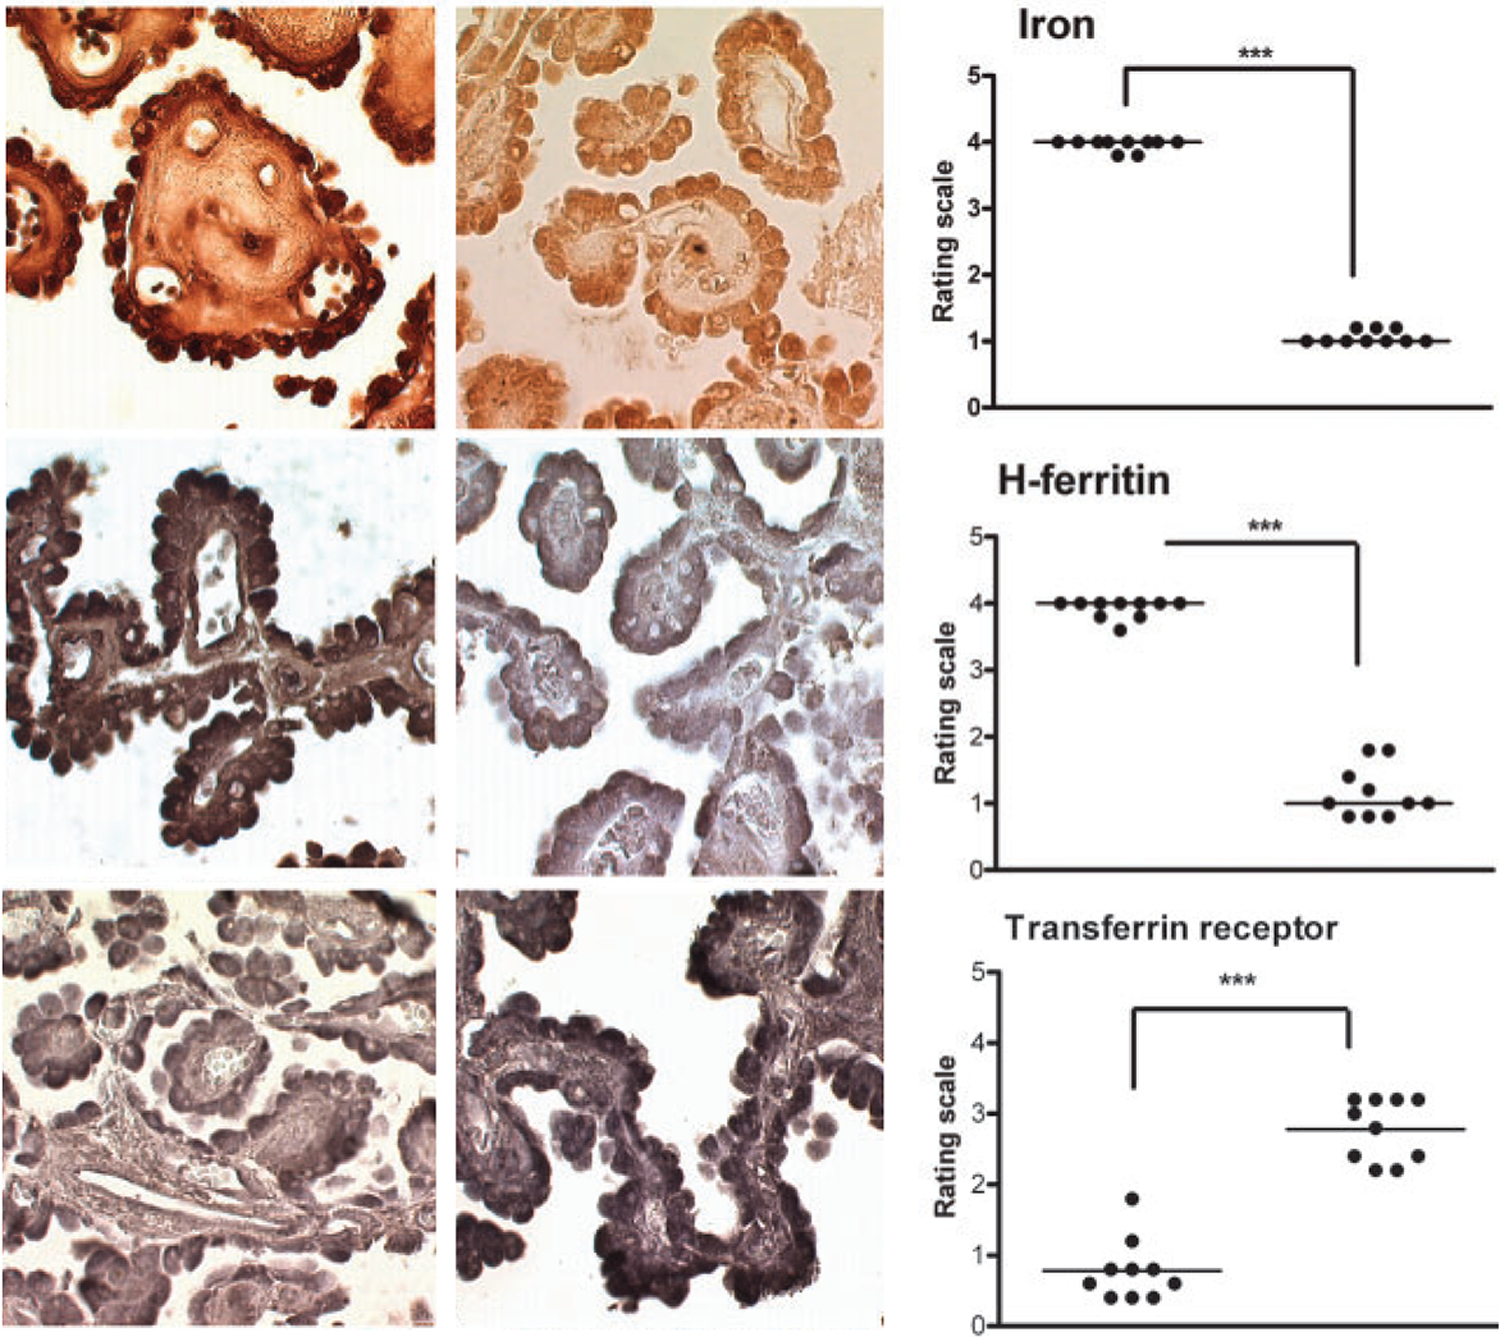
Iron deficiency in choroid plexus tissue from RLS patients. Upper, middle and lower micrographs represent iron, heavy-chain ferritin (H-ferritin) and transferrin receptor staining, respectively, from RLS (left panels) and control subjects (middle panels). Right panels represent the respective quantitative analysis, showing a very significant decrease of iron and H-ferritin densities (***) and a significant increase in transferrin receptor density (***) in RLS (left scatterplots) versus control subjects (right scatterplots). Reproduced and modified from Connor and others 2011.