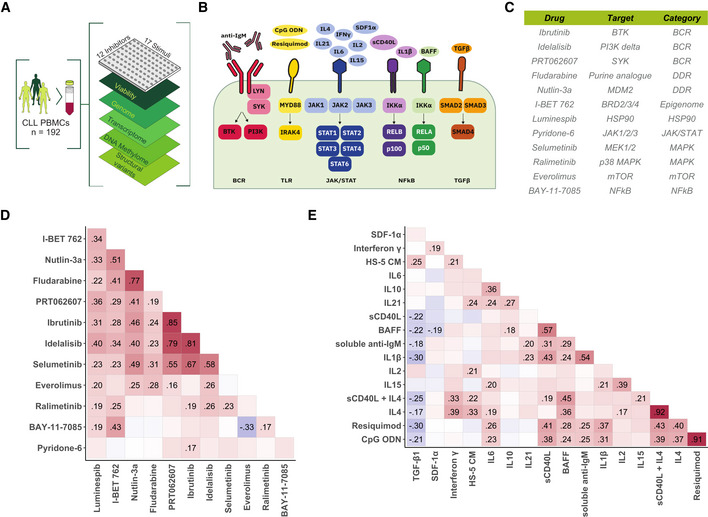
Figure 1. Study outline and overview of drugs and stimuli.

-
ASchematic of experimental protocol. We measured tumour cell viability after exposure to 12 drugs and 17 microenvironmental stimuli, both individually and in combination, in primary CLL samples (n = 192). Integrating these data with genomic, transcriptomic, DNA methylation and copy number variation data, we identified pro‐survival pathways, molecular modulators of drug and microenvironment responses, and drug‐stimulus interactions in CLL. The combinatorial data cube (12 × 17 × 192) can be accessed in toto (github.com/Huber‐group‐EMBL/CLLCytokineScreen2021) and explored interactively, via the shiny app (www.dietrichlab.de/CLL_Microenvironment/).
-
BOverview of stimuli included in the screen and their primary annotated targets. In addition, we also used medium condition by the human stroma cell line HS‐5.
-
CTable of drugs included in the screen. Drug target and category of target are also shown.
-
D, EPearson correlation coefficients, taken across the 192 patient samples, of the logarithm of the relative viability after single treatment with drug (D) and stimulus (E) treatments. Text labels indicate correlation coefficients for those pairs where the correlation was significantly different from 0 at a false discovery rate (FDR) threshold of 0.05 (method of Benjamini & Hochberg (1995)), adjustment performed separately for drug and stimulus correlations).
