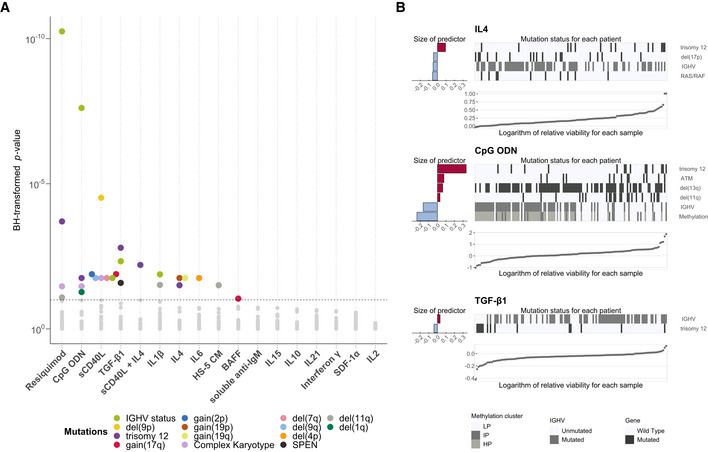
Figure 3. Responses to microenvironmental signals are modulated by recurrent genetic features in CLL.

- Overview of genetic feature‐stimulus associations. x‐axis shows stimuli, and y‐axis shows P‐values from Student's t‐tests (two‐sided, equal variance). Each dot represents a genetic feature‐stimulus association. Tests with P‐values smaller than the threshold corresponding to an FDR of 10% (method of Benjamini & Hochberg (1995)) are indicated by coloured circles, where the colours represent the gene mutations and structural aberrations. All genetic features tested can be found in Appendix Table S1.
- Predictor profiles depicting genetic feature‐stimulus associations identified through Gaussian linear modelling with L1‐penalty, for selected stimuli. The bar plots on the left indicate size and sign of coefficients assigned to genetic features that are associated with response to given stimulus. Positive coefficients indicate higher viability after stimulation if the feature is present. The heatmaps show mutation status in each of the patient samples. The samples were sorted by the logarithm of the relative viability, which is shown in the scatter plots at the bottom. In total, 39 genetic alterations were tested amongst 129 patient samples with complete annotation. LP, low programmed; IP, intermediate programmed; HP, high programmed (Oakes et al, 2016).
