
Figure 4. Trisomy 12 modulates responses to microenvironmental signals.
-
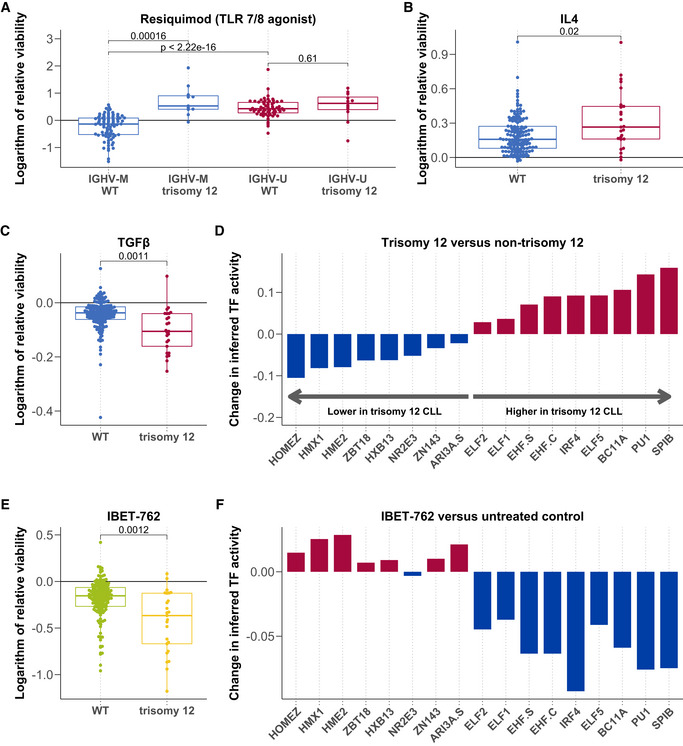
A–CLogarithm of the relative viability after treatment with Resiquimod (A, n = 169), IL4 (B, n = 174) and TGFβ (C, n = 174) stratified by trisomy 12, and in (A), also by IGHV status. P‐values from Student's t‐test (two‐sided, non‐paired). The central bar, boxes and whiskers of the plot represent the median, first and third quartiles, and 1.5‐time IQR, respectively.
-
DChange in inferred TF activity (y‐axis) between samples with (n = 9) and without (n = 43) trisomy 12. Plot shows a change in inferred activity for all TFs with an adjusted P‐value < 0.05. Changes in inferred activity and P‐values for 638 TFs calculated using the diffTF software and data taken from (Rendeiro et al, 2016).
-
ENatural logarithm of the relative viability (n = 174) after treatment with IBET 762 in trisomy 12 and non‐trisomy 12 CLL samples. P‐value from Student's t‐test (two‐sided, non‐paired). The central bar, boxes and whiskers of the plot represent the median, first and third quartiles, and 1.5‐time IQR, respectively.
-
FDifferential inferred TF activity (y‐axis) comparing IBET 762 (n = 4) and control‐treated CLL samples (n = 4). Plot shows inferred activity for the same TFs shown in Fig 4D.