-
A
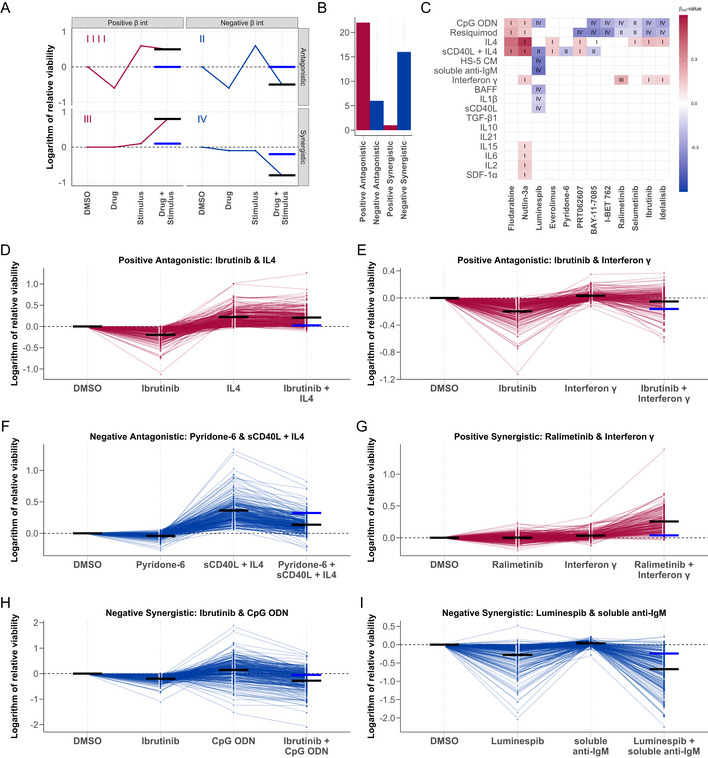
Graphical representation of the four drug‐stimulus interaction categories. Categories are defined according to the nature of the interaction (synergistic or antagonistic), and whether the viability is increased or decreased by the stimulus (positive or negative). x‐axis shows treatment type, and y‐axis shows viability with each treatment. Red and blue points and lines depict a representative treatment response pattern for given interaction type. Blue horizontal lines represent the expected viability for combinatorial treatment in the absence of an interaction between drug and stimulus (i.e. additive effects), and black horizontal lines represent the measured viability after combinatorial treatment. The difference between the black and blue lines indicates the impact of the interaction on expected viability.
-
B
Bar plot of the number of interactions in each category where the P‐value for the interaction term β
int < 0.05.
-
C
Heatmap of all β
int values with associated P‐value < 0.05, annotated with interaction category (I‐IV). Rows and columns indicate drugs and stimuli, ordered according to hierarchical clustering. Scale indicates size and sign of β
int for given drug‐stimulus combination. (I) Positive β
int and antagonistic (microenvironmental stimulation reduces drug effect). (II) Negative β
int and antagonistic (drug reduces stimuli effect). (III) Positive β
int and synergistic (microenvironmental stimulation and drug have synergistic pro‐survival effect). (IV) Negative β
int and antagonistic (microenvironmental stimulation and drug show synergistic toxicity).
-
D–I
Examples of drug‐stimulus interactions, for each category. Plots show the natural logarithm of the relative viability of 192 CLL samples after treatment with the respective drug and stimulus. Each line represents one patient sample linked across treatments. Black horizontal lines in each single treatment indicate the expected viability based on linear modelling. Black and blue horizontal lines in the combinatorial treatment indicate the expected viability based on the additive effect of the drug and stimulus (blue), and the expected viability accounting for the additive effect and the interaction (black). (D + E) Ibrutinib, a clinically used BTK inhibitor, is blocked by IL4 and IFNγ. (F) The JAK inhibitor pyridone‐6 inhibits the pro‐survival effect of sCD40L + IL4 stimulation. (G) The p38 inhibitor ralimetinib and IFNγ show a synergistic pro‐survival effect not observed in either single treatment. (H) TLR agonists, including CpG ODN (shown), increase sensitivity to BTK inhibition by ibrutinib, despite increasing viability as single treatments. (I) Soluble anti‐IgM sensitises CLL samples to HSP90 inhibition by luminespib.

