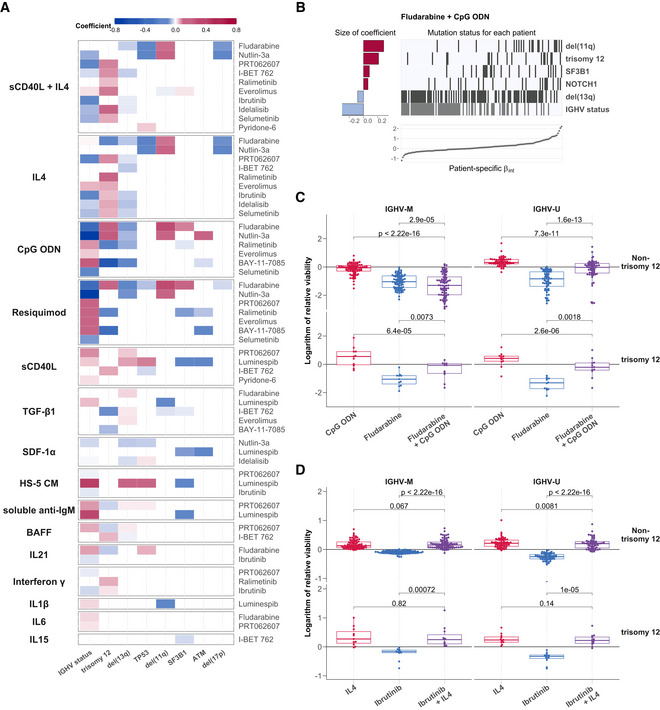
Figure 6. Integrating the effects of genetic features and stimuli on drug response.

-
AHeatmap depicting genetic predictors of drug‐stimulus interactions. Each row indicates genetic features that are associated with the size of interaction between the drug (right) and stimulus (left), that is, each row depicts the coefficients of a single multivariate model fit as in (B)). Coloured fields indicate that β int for given drug and stimulus is modulated by corresponding genetic feature. Positive coefficients are shown in red, indicating a more positive β int if the feature is present. For clarity, plot shows eight most common genetic features and omits drug‐stimulus combinations where no coefficient was assigned to any of these eight features. Heatmap of coefficients for all tested genetic features can be seen in Appendix Fig S18.
-
BPredictor profile depicting genetic features that modulate the interaction between fludarabine and CpG ODN, identified using multivariate modelling. The horizontal bars on the left show the size of coefficients assigned to genetic features by model. The matrix in the centre indicates patient sample mutation status for the given genetic features aligned with the scatter plot below indicating the size of β int for the same patient sample. Grey lines indicate the presence of genetic feature/IGHV mutated.
-
C, DBeeswarm boxplots of the natural logarithm of the relative viability of 169 CLL samples, for (C) fludarabine + CpG ODN and (D) ibrutinib + IL4 single and combinatorial treatments, faceted by IGHV status and trisomy 12 status. P‐values from paired Student's t‐test. The central bar, boxes and whiskers of the plot represent the median, first and third quartiles and 1.5‐time IQR, respectively.
