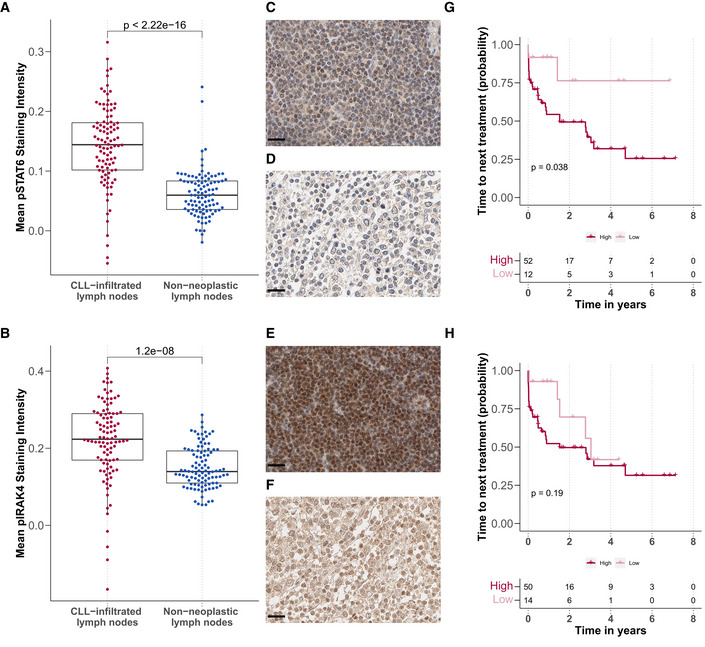
Figure 7. IL4 and TLR signalling is upregulated in CLL‐infiltrated lymph nodes.

-
A, BMean (A) pSTAT6 and (B) pIRAK4 staining intensity in CLL‐infiltrated (n = 100 for pSTAT and pIRAK4) and tumour‐free lymph node biopsies (n = 98 for pSTAT6 and n = 100 for pIRAK4) after background subtraction (y‐axis), P‐values from Student's t‐test. Each dot represents the mean of all cells in the tissue microarray cores per patient sample. The central bar, boxes and whiskers of the plot represent the median, first and third quartiles, and 1.5‐time IQR, respectively.
-
C–FExample images of immunohistochemistry sections: (C + D) pSTAT6 levels in (C) CLL‐infiltrated and (D) tumour‐free samples. (E + F) pIRAK4 levels in (E) CLL‐infiltrated and (F) tumour‐free samples. Scale bar defines 20 μm in all images.
-
G, HKaplan–Meier plots for time to next treatment stratified by levels (high/low) of pSTAT6 (G) and pIRAK4 (H). P‐values from univariate Cox proportional hazard models.
