Figure 3.
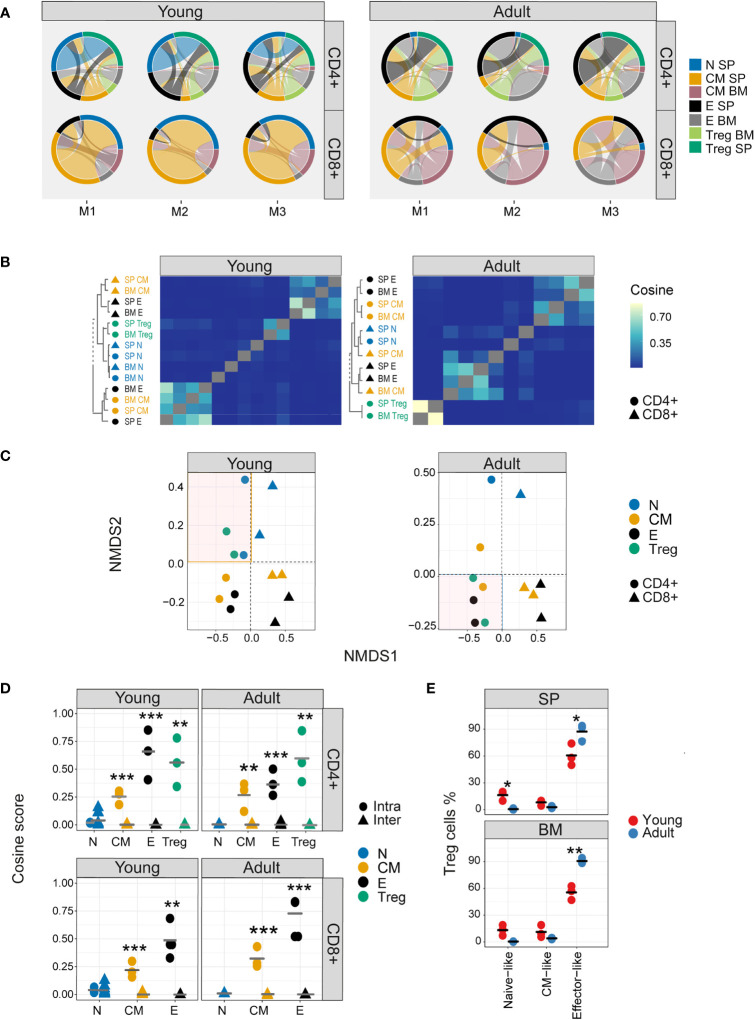
Nucleotide sequence sharing patterns differ between T cell sub-compartments. (A) Each circus plot represents a single mouse CD4+ or CD8+ compartment (upper and lower panel, respectively). Circus sharing levels illustrate the number of clones shared between two compartments (band widths), and the proportion of shared clones attributed to each compartment (circus arcs). Only sequences shared by at least two compartments were included in the analysis. (B) Pairwise cosine similarity of the CDR3βNT sequences from representative young and adult mouse repertoires. Correlation levels are represented by color (high=light blue, low= dark blue). In color and text, hierarchical clustering dendrograms for all T cell compartments are plotted to the left of each heatmap (CD4+=circle, CD8+= triangles). (C) The similarity matrices shown as heatmaps in B are represented in two dimensions by NMDS. (D) Cosine similarity between CDR3NTβ chains across (triangles) and within individuals (between spleen and bone marrow, circles). T cells compartments (colored dots) are divided to CD4+ (upper) and CD8+ (lower) from young (left) and adult (right) mice repertories. Mean is shown by horizontal black lines. (E) The surface phenotype of Foxp3+ Tregs. The plot shows the percentage of Foxp3 positive cells (Treg) which have the phenotype: CD44- CD62L+ (naive-like), CD44+CD62L+ (central memory -like) or and CD44+CD62L- (effector-like). Mean is shown by horizontal black lines. Each data point represents one mouse. Significant differences between age groups or intra and inter individuals are denoted by asterisks (P-values: *<0.05, **< 0.01, ***< 0.001, with FDR correction t-test).

