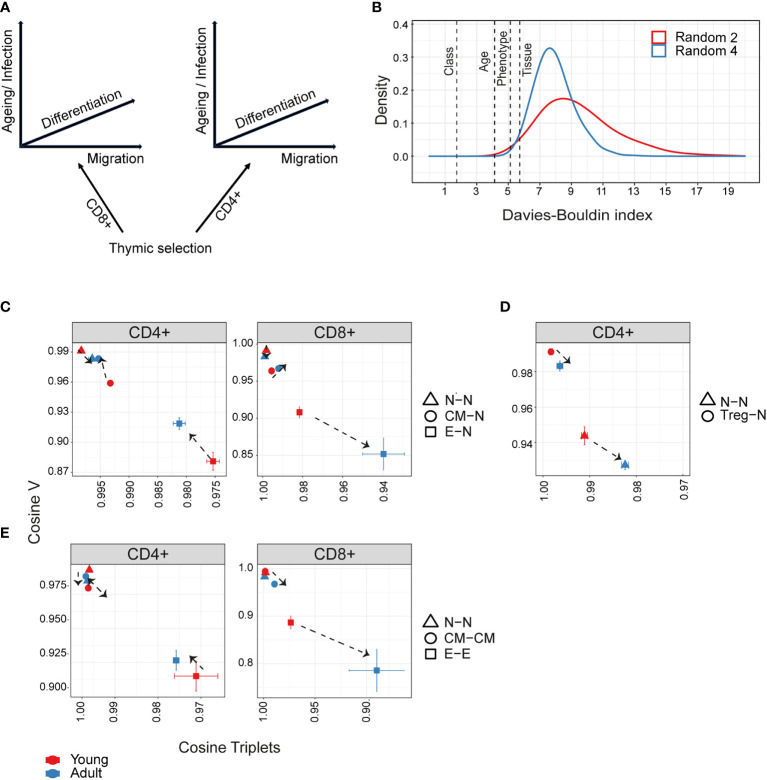
Figure 5.
Hierarchical impact of different immunological processes on repertoire diversification. The TCR repertoire is considered as evolving in four dimensions, captured by the diagram in (A). (B)The Davies-Bouldin (DB) index applied to Vβ frequencies, capturing the average separability (ratio of the within-cluster variance to the separation between cluster centroids (lower score means better clustering)) of clusters of different repertoires from their nearest counterpart. The reference distribution computed by assigning random clusters features (2 or 4 variables, red and blue lines respectively) to the same data and calculating the DB index 10000 times. (C–E) The mean inter-repertoire cosine similarity values of the Vβ gene distribution versus the mean inter-repertoire cosine similarity values for the 350 most abundant CDR3βAA triplets. (C, D) Each repertoire (spleen only) is compared to the young naive repertoires for CD4+, CD8+ (C) and CD4+ Treg (D). In E, each repertoire is compared to each other repertoire from the same compartment. The error bars represent SEM. Arrows show shift from young (red dots) to adult (blue dots).

