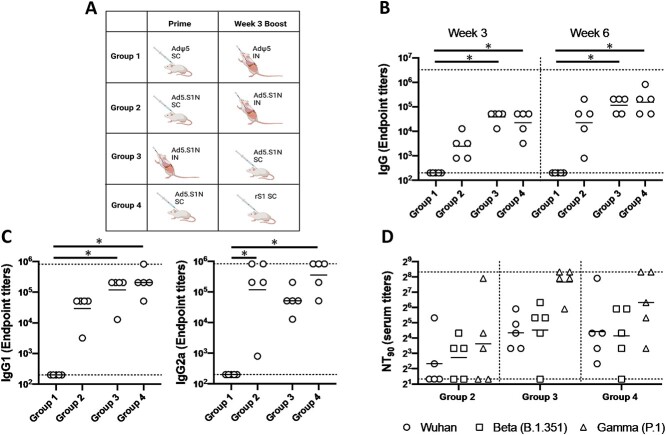
Figure 4.
Homologous and heterologous prime-boost vaccination with Ad5.SARS-CoV-2-S1N (Ad5.SIN) using differing vaccination routes along with recombinant S1 protein (rS1). (A) Schematic layout of mice (N = 5 mice per group) vaccinations. Group 1 served as control with SC AdΨ5 (1 × 10¹⁰ v.p.) prime and IN AdΨ5 (1 × 10¹⁰ v.p.) boost. Group 2 primed with SC Ad.S1N (1 × 10¹⁰ v.p.) and IN Ad.S1N (1 × 10¹⁰ v.p.) boost. Group 3 primed with IN Ad.S1N (1 × 10¹⁰ v.p.) and SC Ad.S1N boost (1 × 10¹⁰ v.p.). Group 4 primed with SC Ad.S1N (1 × 10¹⁰ v.p.) and SC non-adjuvanted rS1 boost (15 μg). On weeks 3 and 6 after vaccination, the sera from mice were collected, serially diluted (200×), and tested for the presence of SARS-CoV-2-S1-specific (B) IgG antibody levels. (C) Week 6 sera were tested for the presence of IgG1 and IgG2 antibody levels. (D) Week 6 serum from immunized mice was tested for neutralizing antibodies using a plaque reduction neutralization test (PRNT) with three different SARS-CoV-2 strains from Wuhan, South Africa (Beta B.1.351), or Brazil (Gamma P.1). Neutralization of Wuhan strain represented by circle, neutralization of Beta B.1.351 represented by square, and neutralization of Gamma P.1 represented by triangle. Serum titers that resulted in a 90% reduction in SARS-CoV-2 viral plaques (NT90) compared to the virus control are reported at 6 weeks after immunization and bars represent geometric means. No neutralizing antibodies were detected in serum PBS control group (not shown). Significance was determined by Kruskal-Wallis test followed by Dunn’s multiple comparisons (*p < 0.05). Horizontal lines represent geometric mean antibody titers. Horizontal dotted lines represent minimum and maximum dilutions. Results are from a single animal experiment. (N = 5 mice per group). ELISA experiments were conducted twice while neutralizing antibody experiments were conducted once.

