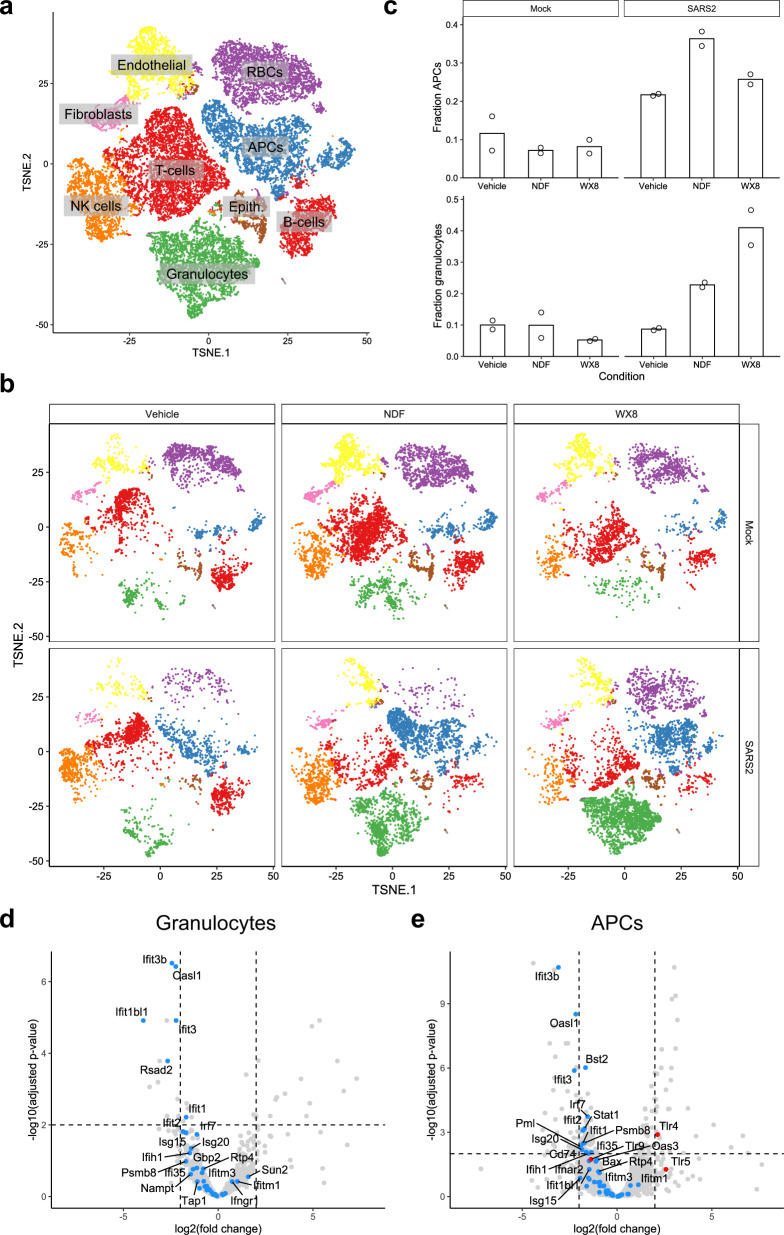
Fig. 4. Single-cell sequencing analysis for PIKfyve inhibitor-treated animals against SARS-CoV-2 infection in mice.
a, b t-SNE plot of scRNAseq data for a all samples or b faceted by condition. Cells are colored by cluster (k-means, n = 9), and clusters are labeled by cell type. c Bar plot showing the fraction of cells within the APC (top) and granulocyte (bottom) clusters. d, e Volcano plot showing differentially expressed genes in SARS-CoV-2-infected cells treated with WX8 versus untreated cells in the d granulocyte and e APC clusters. ISGs and genes in the interferon signaling pathway are colored blue (and labeled where space allows). TLRs in (e) are colored red. APC, antigen-presenting cells; Epith., epithelial cells.

