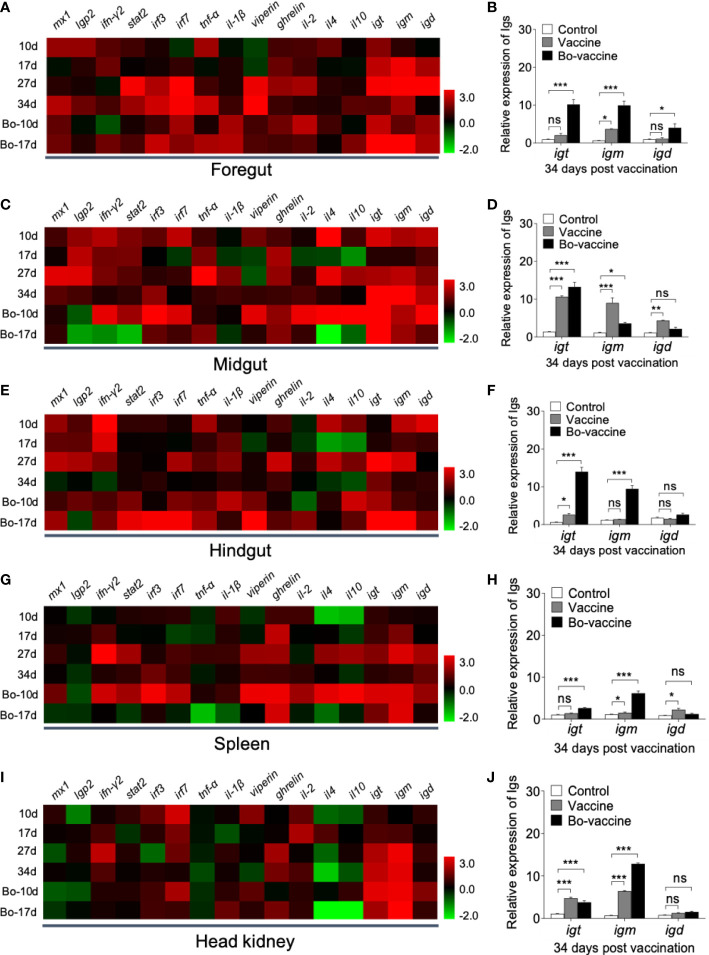
Figure 5.
Immune responses in gibel carp vaccinated with oral administration of CyHV-2 yeast vaccine. Heat map illustrates expression profiles of immune genes in gibel carp foregut (A), midgut (C), hindgut (E), spleen (G), and head kidney (I) of vaccine and bo-vaccine vs. control fish measured at 10,17, 27, and 34 dpv (n = 6 fish per group). Color value: log2 (fold change). (B, D, F, H, J) Fold changes of igt, igm and igd in foregut, midgut, hindgut, spleen, and head kidney was detected at 34 dpv (n = 6 fish per group). Control vs. Vaccine and Bo-vaccine: ns, not significant, *P < 0.05, **P < 0.01, ***P < 0.001, one-way ANOVA with Bonferroni correction. Data are representative of three different independent experiments (mean ± SEM).

