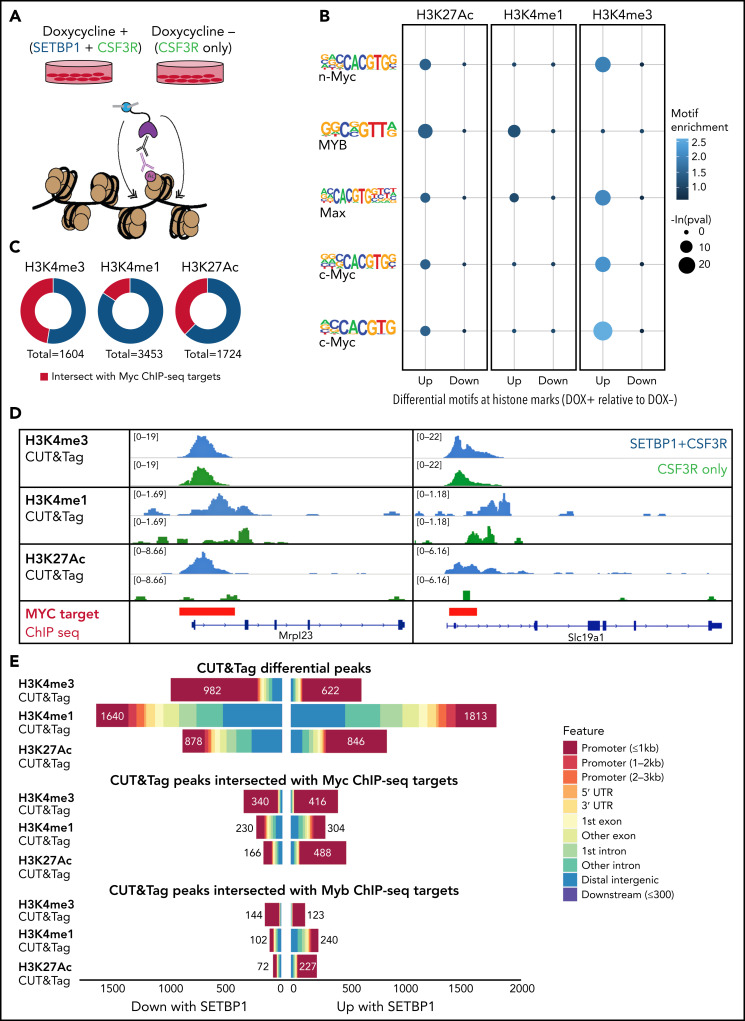
Figure 5.
Epigenetic regulation of MYC targets by SETBP1. (A) Schematic: we performed CUT&Tag in our CSF3RT618I plus SETBP1D868N-dox cell line for 3 histone marks. Doxycycline (DOX) was withdrawn from the cell line to turn off oncogenic SETBP1 expression, and cells were harvested for epigenetic analyses at 24 hours postwithdrawal. (B) MYC family motifs identified for each histone mark at differential peaks between DOX+ and DOX− conditions. Motif enrichment shown for DOX+ relative to DOX−. (C) Regions of significant SETBP1-induced histone peaks were intersected with MYC (ENCFF152JNC). (D) Representative tracks are shown here for each histone mark at the location of an MYC target identified using MYC chromatin immunoprecipitation (ChIP)–seq data from ENCODE (ENCFF152JNC). (E) Features plots for differential peaks showing the breakdown of peaks within promoters and other elements. Regions of significant SETBP1-induced histone peaks were intersected with either MYC (ENCFF152JNC) or MYB (ENCFF911NHJ) ChIP-seq data. The total number of differential peaks for each condition is annotated. UTR, untranslated region.

