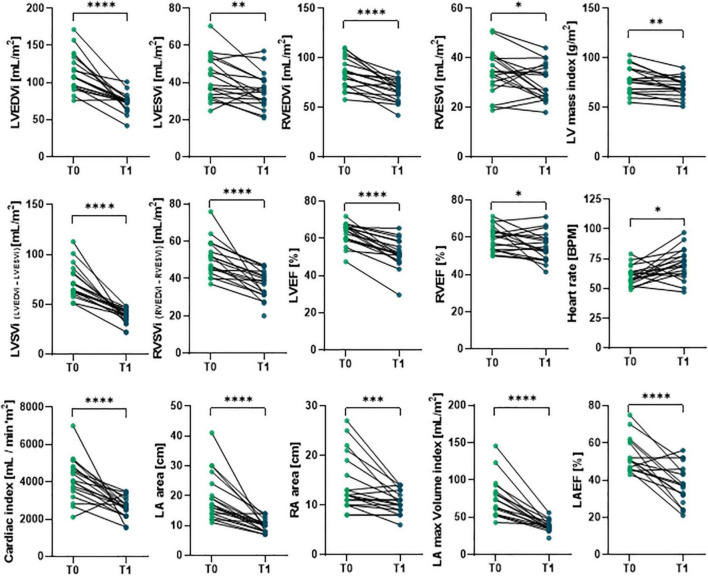
FIGURE 1.
Comparison of preoperative and postoperative CMRI results in primary MR patients undergoing MVR surgery. The CMRI was performed on patients undergoing MVR surgery (n = 19) before (T0) and 6 months after (T1) surgery. Individual data are shown for each patient at both time points; statistical comparison between T0 and T1 was performed by paired Student’s t-test or the Wilcoxon test depending on data distribution. *p < 0.05; **p < 0.01; ***p < 0.001; ****p < 0.0001.

