FIGURE 3.
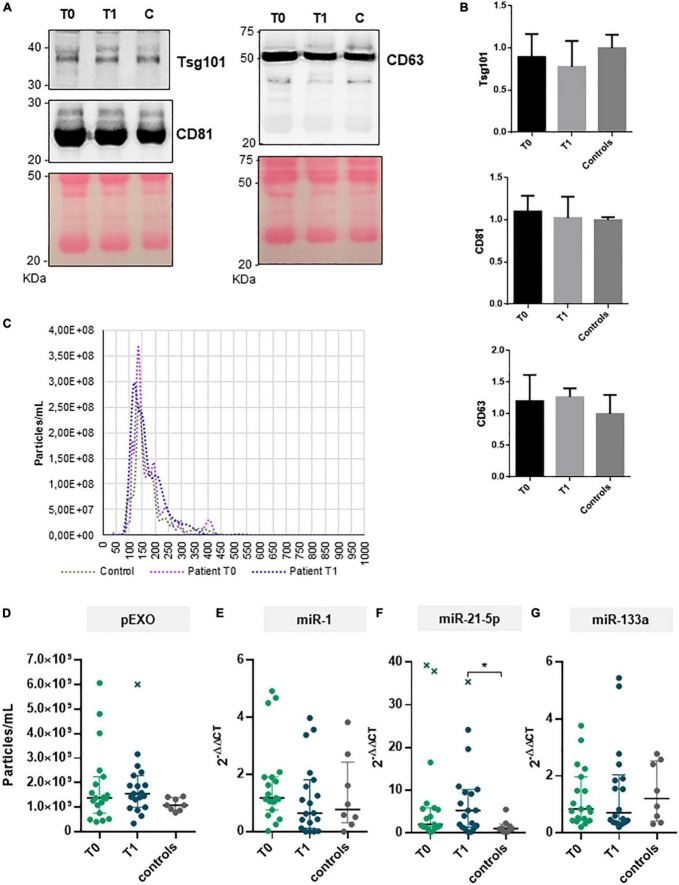
pEXOs and exosomal miRNAs in primary MR patients subjected to MVR surgery. The pEXOs were isolated from plasma of MR patients (n = 19) collected before (T0) and 6 months after MVR surgery (T1); pEXOs isolated from healthy controls (n = 8) were used as control. (A,B) The exosomal markers TSG101, CD81, and CD3 were assessed on the isolated particles by Western blot as described in the methods. (A) One representative experiment is shown. (B) Densitometric analysis of each protein target normalized for the corresponding experiment’s Ponceau staining shows no difference in marker expression among extracts (N = 3 patients/group). (C) Isolated pEXOs were analyzed by NTA as described in the methods; representative size distribution curves are shown. (D) The pEXOs concentrations were inferred by the NTA’s size distribution curve and shown as particles/ml of starting plasma. (E–G) Exosomal miRNA-1 (E), miRNA-21-5p (F) and miRNA-133a (G) were assessed by qRT-PCR as described in the methods. Individual data, median value and interquartile range are shown in the graphs. Statistical significance of the differences between matching T0 and T1 data was evaluated by paired Student’s t-test or the Wilcoxon test depending on data distribution. Statistical differences between patients and controls were evaluated by one-way ANOVA (with or without Brown–Forsythe modification for heteroscedastic groups) or the Kruskal–Wallis test, depending on sample distribution; *p < 0.05.

