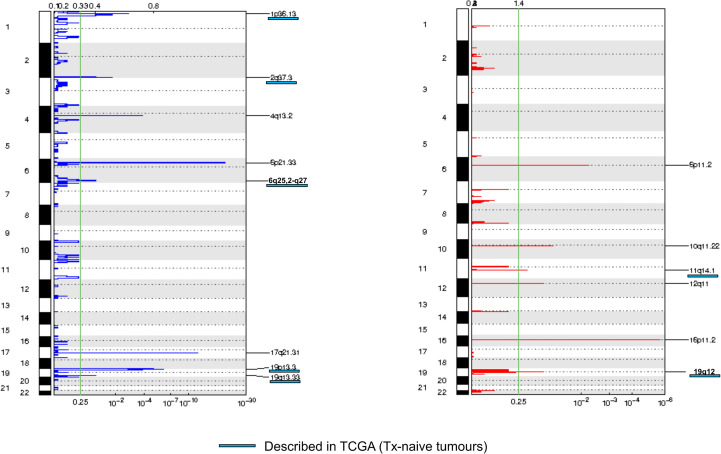
Figure 2.
Frequency plot of recurrent copy number alterations identified in tumor samples using the GISTIC algorithm. Frequencies of losses (left) and gains (right) are plotted as a result of chromosome location. x-axis: top = log-scale ratio; bottom = q-values. Alterations described in TCGA are underlined in blue. Green lines represent the threshold for significance.

