Figure 5.

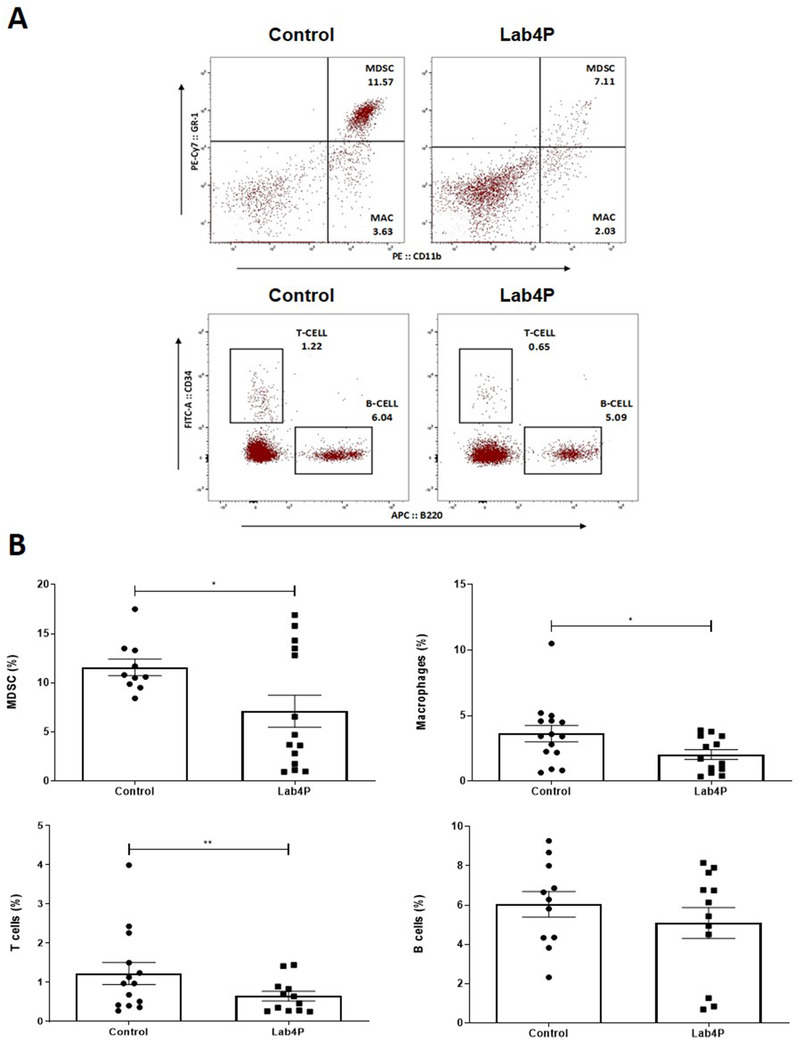
The effect of Lab4P supplementation on bone marrow lineage differentiated cell populations. Immunophenotyping of bone marrow cell populations from LDLr−/− mice was performed following 12 weeks feeding with either HFD (control; n = 15) or HFD supplemented with Lab4P (probiotic; n = 15). (A) Representative flow plots showing lineage positive cell populations in control and Lab4P groups. Gating shows position of populations representing MDSC (GR‐1+CD11b+), monocytes/macrophages (MAC; GR‐1−CD11b+), T Cells (CD3+B220−) and B Cells (CD3−B220+). (B) The graphs show the frequency of MDSC, monocyte/macrophage (Macrophages), T cell and B cell populations as indicated. The data are mean ± SEM with statistical analysis performed using an unpaired Student's t‐test (*p < 0.05, **p < 0.01).
