
Figure 6.
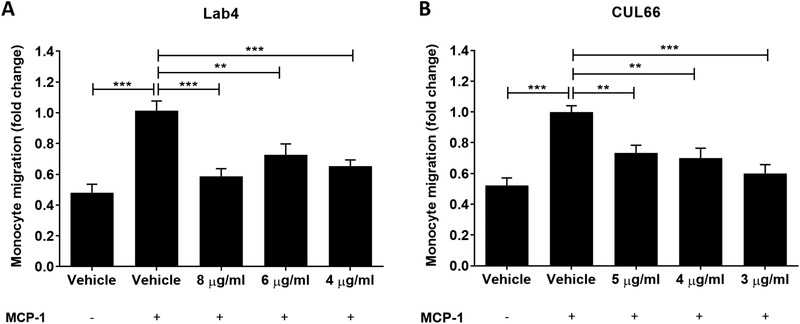
MCP‐1 driven migration of human monocytes was attenuated by different concentrations of CM from Lab4 or CUL66. Migration assays were carried out on THP‐1 monocytes as described in Section 4 using Lab4 CM at concentrations of 8, 6, and 4 µg mL‐1 (A) or CUL66 CM at concentrations of 5, 4, and 3 µg mL‐1 (B). Cells treated with vehicle but in the absence of MCP‐1 were also included for comparative purposes. Migration was determined as a percentage of the total input cells and displayed as fold‐change in migration relative to the Vehicle control which was arbitrarily set to 1. Data are presented as mean ± SEM from five (A) or three (C) independent experiments. Statistical analysis was performed using a one‐way ANOVA with Dunnett (2‐sided) post‐hoc test where **p < 0.01 and ***p < 0.001.