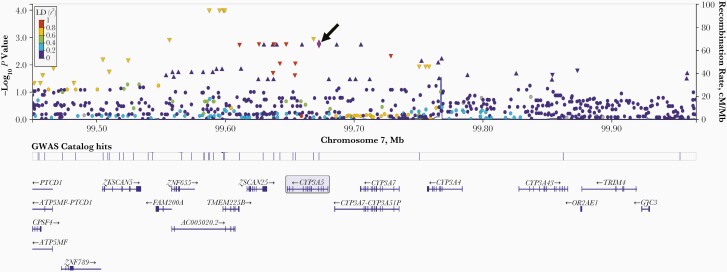
Figure 1.
LocusZoom plot of associations with between-individual variability in bedaquiline clearance, across the CYP3A locus on chromosome 7. Represented are −log10P values among 140 individuals for 1214 polymorphisms in the region, ranging from −150 kB from the 3’ end of CYP3A5 to +150 kB from the 5’ end of CYP3A4. Purple diamond and arrow identify CYP3A5 rs776746 (CYP3A5∗3 [arrow]), which is used as the reference for the linkage disequilibrium (LD) values in the graph. Each other marker is color coded to indicate r2 value categories for LD with rs776746, as shown in the legend. These LD values are based on the “ALL” LocusZoom setting for the reference population

