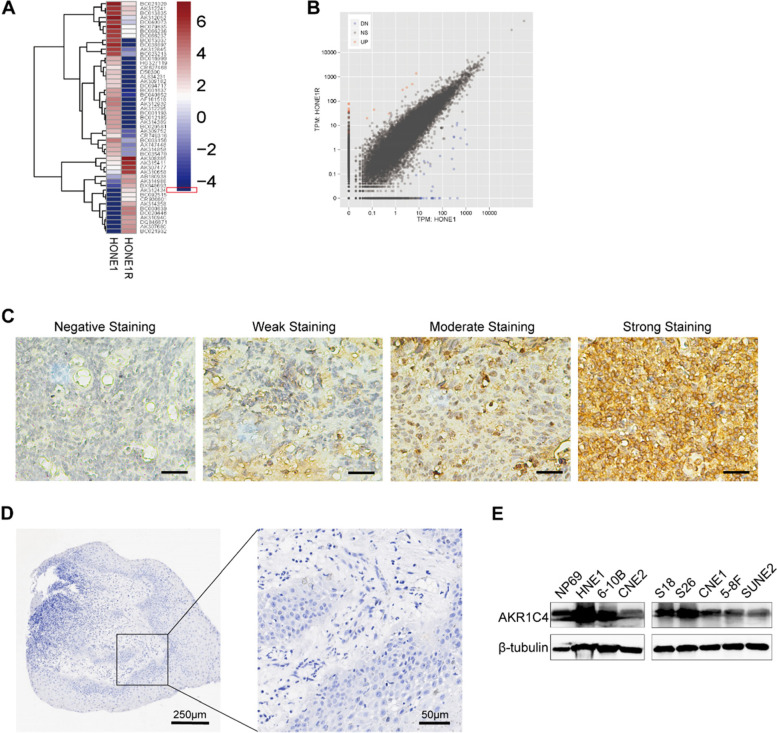
Fig. 1.
AKR1C4 expression profile. A Heat map demonstrated expression pattern of different genes in HONE1 vs. HONE1-IR. High or low expression was reflected as red or blue indicated in the scale bar, respectively. Herein, locus AK314988 (highlighted by red frame), which was AKR1C4, showed a significant higher expression in HONE1-IR than in HONE1. B In scatter plot, red and blue dots represented upregulation and downregulation of gene expression, respectively, and AKR1C4 expression was elevated in HONE1-IR cell line, which indicated a robust replicability of RNA-seq samples. C Representative images of different intensities of immunohistochemical staining for AKR1C4 in nasopharyngeal carcinoma (NPC) tissues (200 ×): Negative staining, weak staining, moderate staining, and strong staining. All micrographs were taken and processed at identical conditions. Scale bar: 50 μm. D IHC result of normal nasopharyngeal mucosa stained for AKR1C4, in magnification 40 × (left) and 200 × (right). E Protein levels of AKR1C4 in different NPC cell lines (HNE1, 6-10B, CNE2, S18, S26, CNE1, 5-8F and SUNE2) and normal nasopharyngeal epithelial cell line NP69 were evaluated by western blotting. β-tubulin was used as internal control

