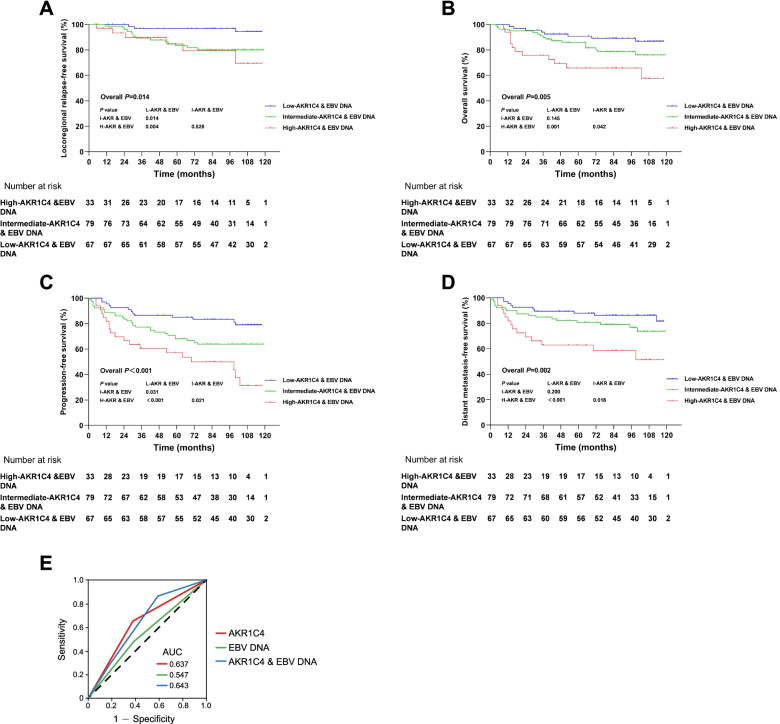
Fig. 4.
Kaplan–Meier curves of survival outcomes for patients between high-AKR1C4 and EBV DNA, intermediate-AKR1C4 and EBV DNA, and low-AKR1C4 and EBV DNA patients. Patients with high AKR1C4 (> 4) and high EBV DNA level (≥ 4000 copies/ml) simultaneously were defined as high-AKR1C4 and EBV DNA, low AKR1C4 (≤ 4) and low EBV DNA level (< 4000 copies/ml) were grouped as low-AKR1C4 and EBV DNA, and the rest of the circumstances were considered as intermediate-AKR1C4 and EBV DNA, which were abbreviated as H-AKR & EBV, L-AKR & EBV, and I-AKR & EBV, respectively. A Locoregional relapse-free survival. B Overall survival. C Progression-free survival. D Distant metastasis-free survival. E Receiver operating characteristic (ROC) curve of three different models predicting recurrence of NPC patients. Area under the curve (AUC) indicated the predictive efficacy, the closer the AUC reaches 1, the higher the efficacy predicting recurrence of the model is. The AUC of survival model consisted of AKR1C4 and EBV DNA has higher AUC than model constructed by AKR1C4 or EBV DNA alone

