Fig. 1.
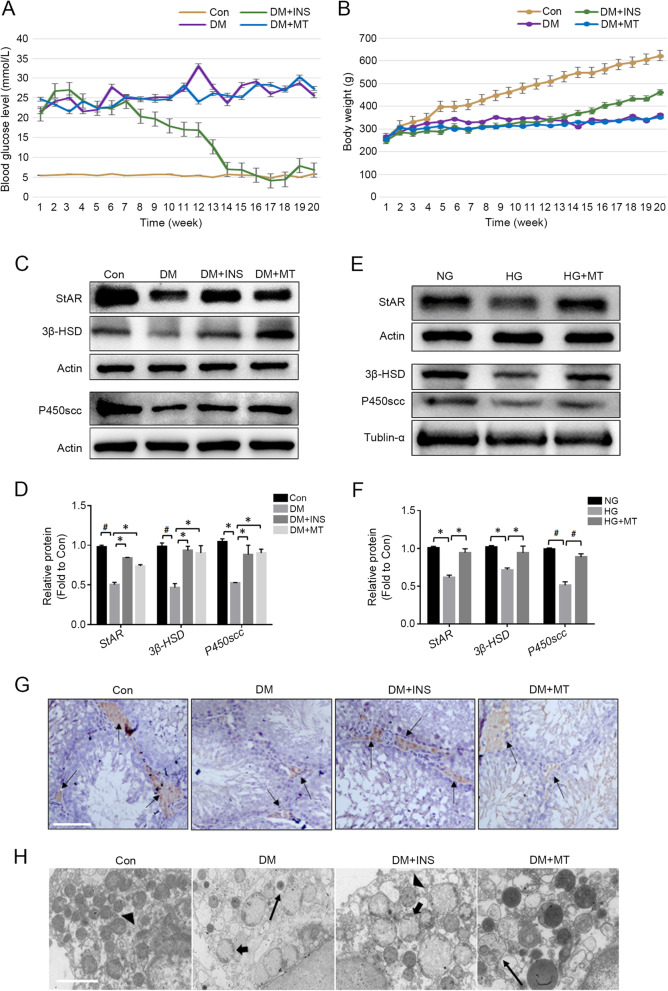
Melatonin alleviated diabetic hyperglycemia-induced impairment of testosterone synthesis in Leydig cells. A Changes in blood glucose level of SD rats. B Body weight changes of SD rats. C-D Protein expression level detection of StAR, 3β-HSD and P450scc in testicular tissues of rats in each group by Western blot and the statistical graph of gray value analysis; E–F Protein expression level detection of 3β-HSD and P450 in TM3 cells by Western blot and gray value analysis. G Immunohistochemical staining of rat testis. Arrow indicates Leydig cells labelled by 3β-HSD antibody. H Ultrastructure of Leydig cells in rat testis. Triangle indicates normal mitochondria, long arrow indicates autophagosomes, and short arrow indicates damaged mitochondria. Con, control group; DM, diabetes mellitus group; DM + INS, insulin treatment group of diabetic rats; DM + MT, melatonin treatment group of diabetic rats; NG, normal glucose control group; HG, high glucose treatment group; HG + MT, high glucose and melatonin treatment group; D-F, Data are expressed as fold change relative to Con. *, P < 0.05; #, P < 0.01. Bar: G, 50 μm; H, 2 μm

