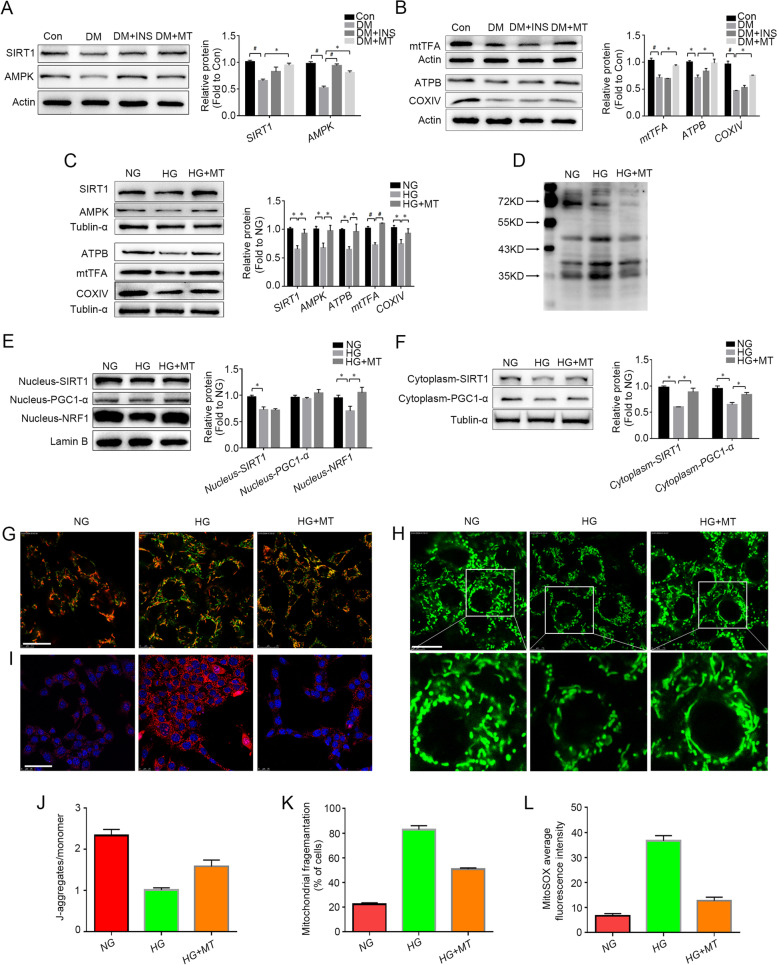
Fig. 2.
Effects of melatonin on AMPK/SIRT1 pathway dysregulation and mitochondrial dysfunction induced by high glucose. A The expression levels of SIRT1 and AMPK in rat testicular tissue detected by Western blot and the statistical graph of gray value analysis. B The expression levels of mitochondrial function-related proteins (mtTFA, ATPB and COXIV) in rat testicular tissue were detected by Western blot and their gray values were analyzed. C The expression levels of SIRT1, AMPK and mitochondrial function-related proteins in TM3 cells detected by Western blot and the statistical graphs of gray value analysis. D Acetylation level of total proteins in TM3 cells of each group was detected. E–F Protein levels of SIRT1, PGC-1α and NRF1 in cytoplasm and nucleus of TM3 cells were detected by Western blot and gray values of the protein bands were analyzed. G and J Mitochondrial membrane potential detection of TM3 cells by JC-1 probe and the ratio of J-aggregates to monomer (green fluorescence) was statistically analyzed. H and K Detection of the number and morphology of mitochondria in TM3 cells by MitoTracker and the percentage of cells with mitochondrial fragmentation (n = 150) was statistically analyzed. I and L Detection of mitochondrial reactive oxygen species in TM3 cells by MitoSOX and average fluorescence intensity analysis. Con, control group; DM, diabetes mellitus group; DM + INS, insulin treatment group of diabetic rats; DM + MT, melatonin treatment group of diabetic rats; NG, normal glucose control group; HG, high glucose treatment group; HG + MT, high glucose and melatonin treatment group; A-B, Data are expressed as fold change relative to Con; C, E–F, Data are expressed as fold change relative to NG. *, P < 0.05; #, P < 0.01. Bar: G-H, 15 μm; I, 50 μm

