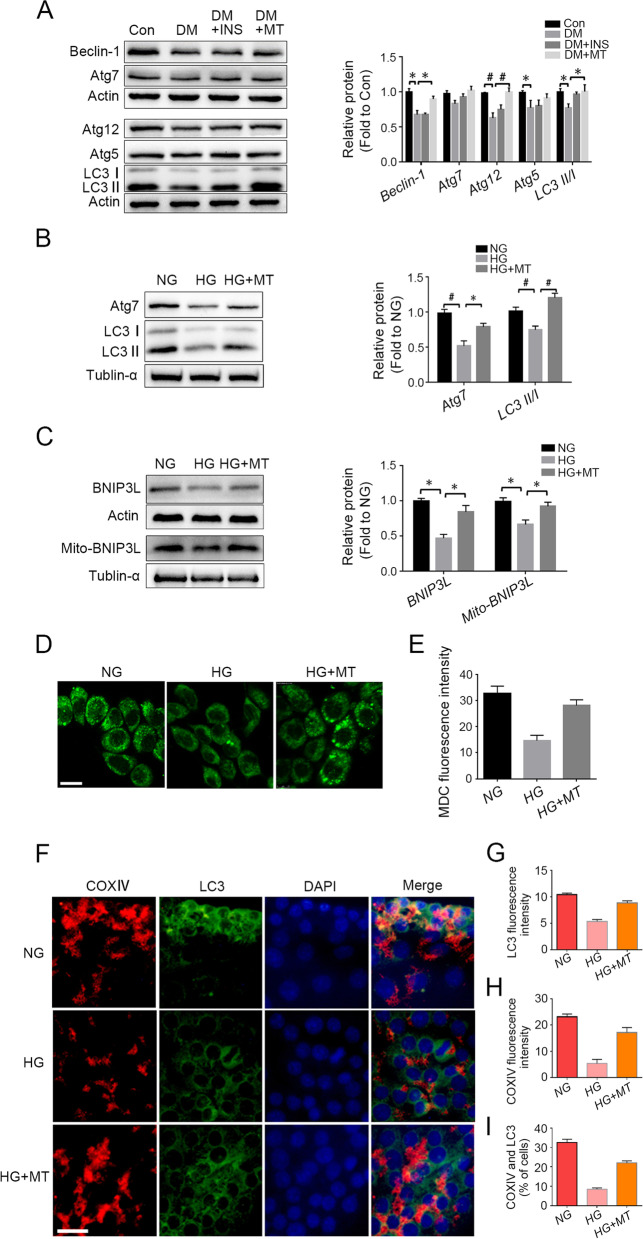
Fig. 3.
Melatonin prevented high glucose-induced decrease in autophagy and mitophagy. A Western blot was used to detect the expression levels of autophagy-related proteins in rat testicular tissue, and gray values were analyzed. B The expression levels of autophagy-related genes in TM3 cells detected by Western blot and statistical analysis of their gray values. C The expression levels of BNIP3L in total protein and mitochondrial protein of TM3 cells was detected by Western blot. D&E Autophagosome formation in TM3 cells was detected by MDC (monodansylcadaverine) staining and their fluorescence intensity was statistically analyzed. F-I. Immunofluorescent co-staining of COXIV and LC3 antibodies to detect mitophagy in TM3 cells and statistical analysis of mitophagy (randomly counting 150 cells). Con, control group; DM, diabetes mellitus group; DM + INS, insulin treatment group of diabetic rats; DM + MT, melatonin treatment group of diabetic rats; NG, normal glucose control group; HG, high glucose treatment group; HG + MT, high glucose and melatonin treatment group; A, Data are expressed as fold change relative to Con; B-C, Data are expressed as fold change relative to NG. *, P < 0.05; #, P < 0.01. Bar: D, 20 μm; F, 100 μm

