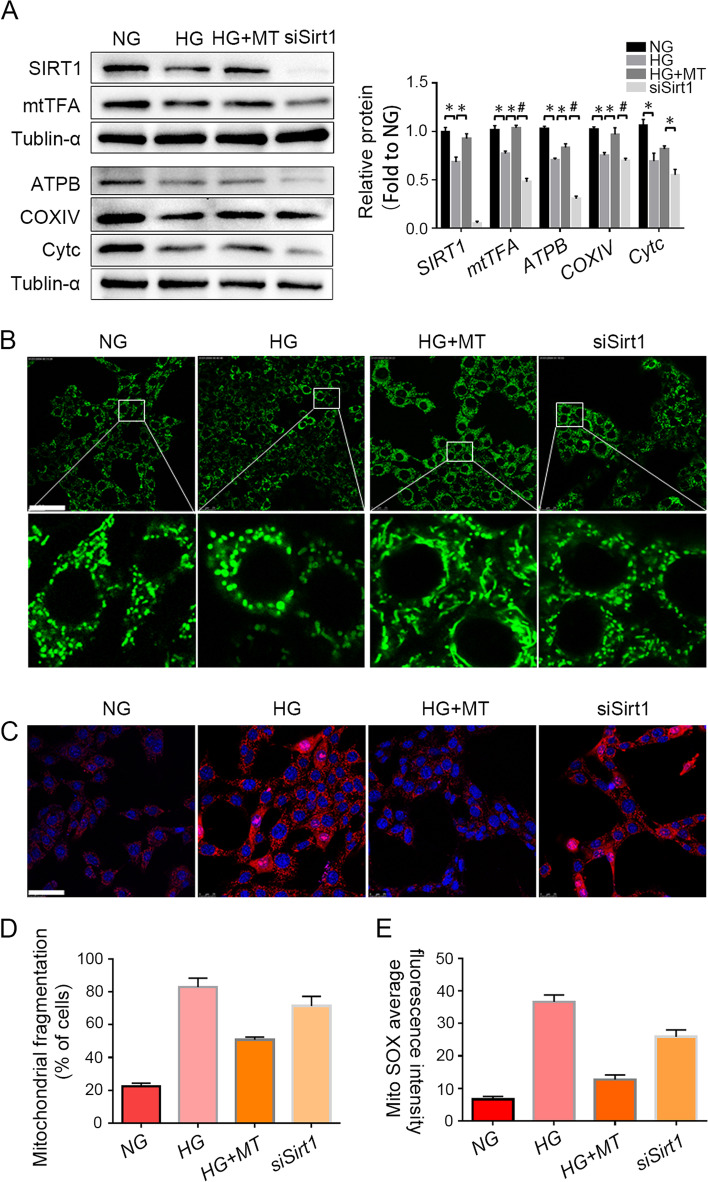
Fig. 5.
Sirt1 knockdown prevented the protective effect of melatonin on mitochondrial dysfunction caused by high glucose. A The expression levels of mitochondrial function-related proteins in TM3 cells were detected by Western blot and their gray values were analyzed. B and D Mitochondria in TM3 cells were stained by MitoTracker fluorescent probe and the percentage of cells with mitochondrial fragmentation (n = 150) was statistically analyzed. C and E Mitochondrial reactive oxygen species in TM3 cells were detected by MitoSOX, and the average fluorescence intensity was statistically analyzed. NG, normal glucose control group; HG, high glucose treatment group; HG + MT, high glucose and melatonin treatment group; siSirt1, HG + MT + siSirt1 group. A, Data are expressed as fold change relative to NG. *, P < 0.05; #, P < 0.01. Bar: B&C, 50 μm

