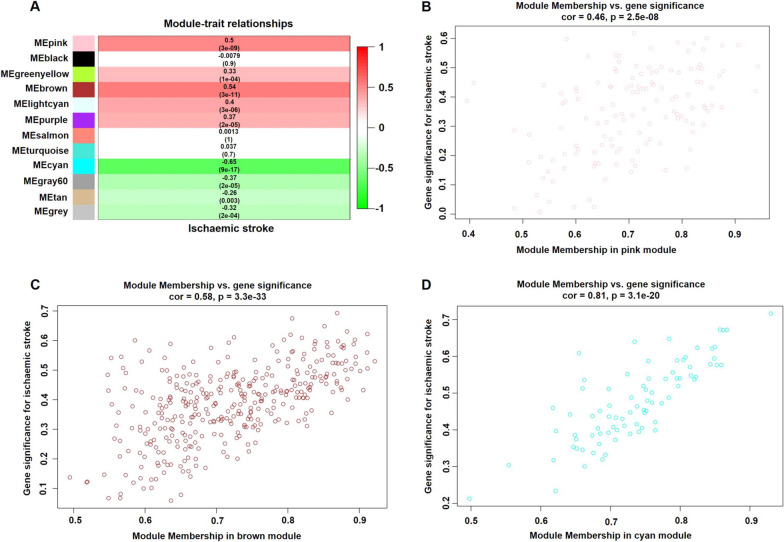
Fig. 3.
Module-feature associations and associations between gene significance and module membership. A Each row corresponds to a modulEigengene, and the column corresponds to the clinical phenotype. Each cell contains the corresponding correlation in the first line and the p value in the second line. The table is colour-coded by correlation according to the colour legend. Scatterplot shows a highly significant correlation between gene significance (GS) versus module membership (MM) with ischaemic stroke in the pink (B), brown (C) and cyan (D) modules

