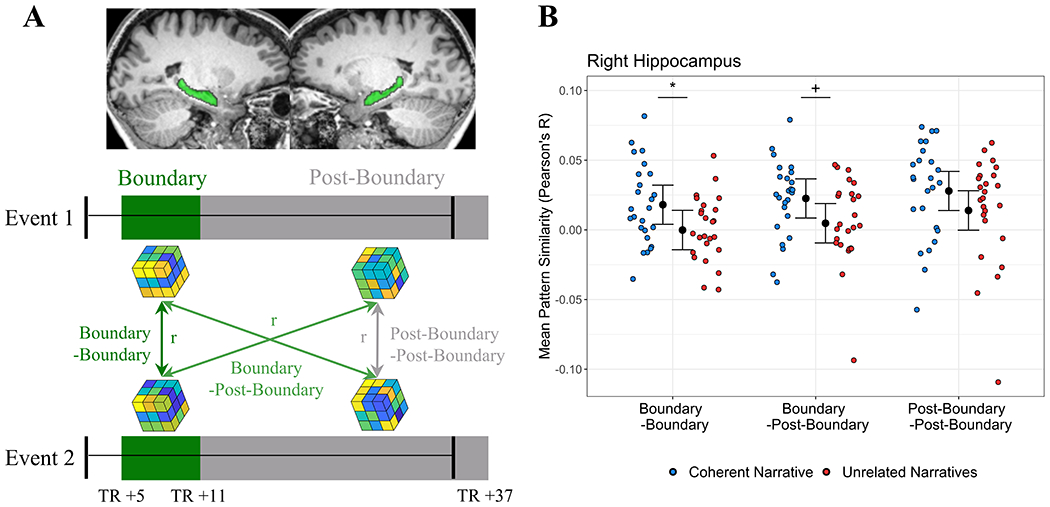
Figure 2: Right hippocampus activity patterns bridge events that form a coherent narrative.

(A) Across-event pattern similarity analysis: within the left and right hippocampus (plotted on an individual subject’s structural MRI, in green), the unique spatial pattern of activity (“voxel pattern”, represented by cubes) was modeled for Boundary (dark green rectangles, TRs +5 to +11) and Post-Boundary epochs (grey rectangles, TRs +12 to +37). Black bars represent the real-time beginning and ending of each Coherent Narrative and Unrelated Narrative event during scanning—epoch definitions account for the lagged BOLD response. Pattern similarity (Pearson’s r) was calculated between voxel patterns at Event 1 and Event 2, and selectively averaged to yield three epoch-by-epoch measures of similarity: Boundary-Boundary (dark green line), Boundary-Post-Boundary (light green lines), and Post-Boundary-Post-Boundary (grey line). See also Figure S1. (B) Right hippocampus pattern similarity: Pearson’s correlations between Event 1 and 2 epochs were computed for Coherent Narrative and Unrelated Narrative events. Mean pattern similarity for individual subjects (colored dots) is plotted on the basis of which epoch was being examined, and whether events could form Coherent Narratives or not (Unrelated Narratives). Mixed model fits predicting pattern similarity are visualized as 95% confidence intervals (see text for model details). Note: pattern similarity is on a continuous scale, and zero or negative values simply reflect relatively lower similarity than positive values (i.e. not “no similarity” or “negative similarity”). Key: Blue=Coherent Narratives, Red=Unrelated Narratives, *=p<0.05, + = p<0.10. See also Figures S2–3.
