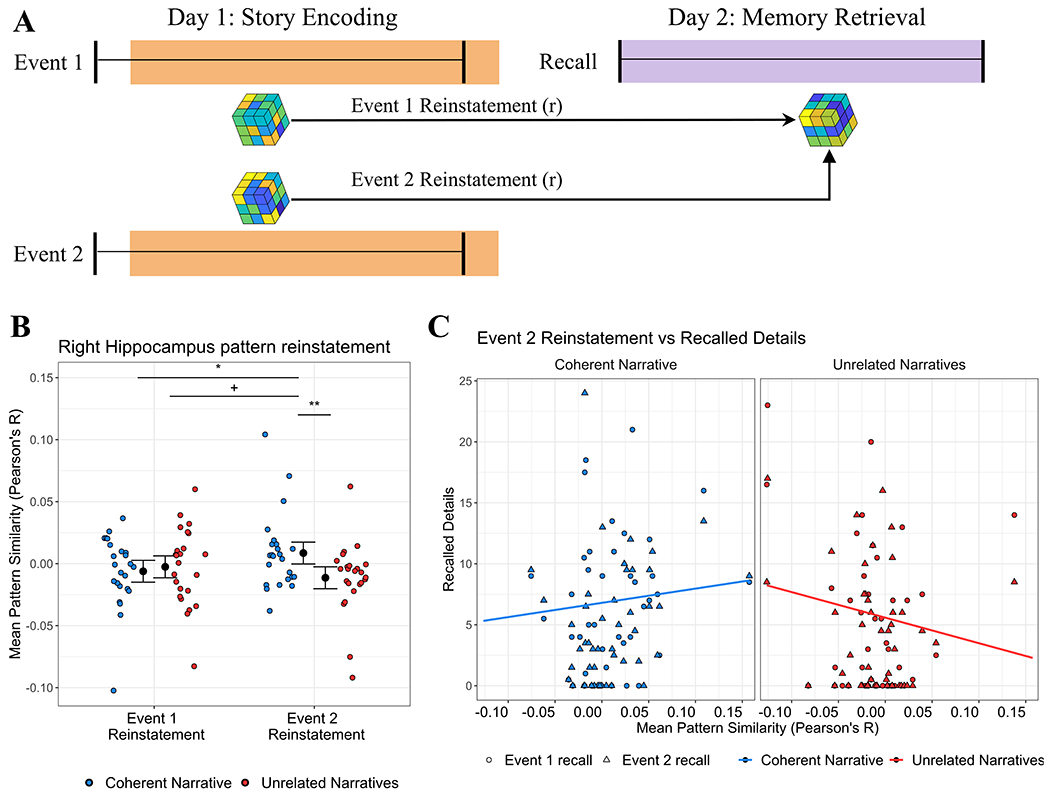
Figure 3: Reinstatement of hippocampal activity from memory encoding supports recall of Coherent Narrative events.

(A) Encoding-retrieval similarity: Pattern similarity (Pearson’s r) was calculated between activity from each event involving a recurring character at encoding (Event 1 or 2), and activity during delayed recall of events involving that character. (B) Event 2 pattern reinstatement is higher for Coherent Narrative recall: Mean encoding-retrieval similarity for each subject (colored dots) is plotted for each epoch of each event during recall. 95% confidence intervals represent mixed model estimates (see text for model details). Note: pattern similarity is on a continuous scale, and zero or negative values simply reflect relatively lower similarity than positive values (i.e. not “no similarity” or “negative similarity”). (C) Event recall predicted by Event 2 pattern reinstatement: Recalled details from Event 1 (circles) and Event 2 (triangles) are plotted for each specific event for each subject, predicted by Event 2 pattern reinstatement. Colored lines represent mixed model estimates (see text for model details). Key: Blue=Coherent Narrative, Red=Unrelated Narratives, +=p<.10 *=p<.05, **=p<.01.
