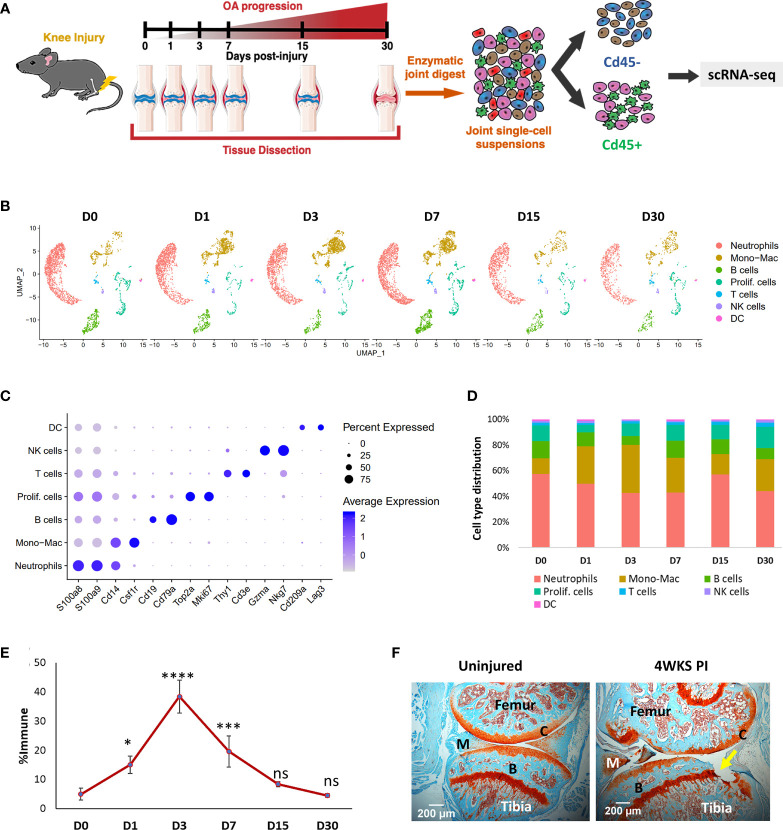
Figure 1.
Single-cell analysis of injury-induced immune changes in 10-week-old BL6 mouse knee joints. (A) Graphical representation of the experimental workflow. Uninjured (D0) and injured (D1, D3, D7, D15 and D30) knee joints were dissected, dissociated into single cells and immune and non-immune fractions were sequenced separately using scRNA-seq. (B) Cell clusters from scRNA-seq analysis visualized by Uniform Manifold Approximation and Projection (UMAP). Colors indicate clusters of various cell types. (C) Dot plot showing the expression of selected markers of various cell types. Dot size represents the fraction of cells expressing a specific marker while the intensity of color indicates the average expression level for each gene. (D) Changes in the proportion of various immune cell types in the joint over time. scRNA-seq analysis showed a dramatic increase in Mono-Macs after injury, which peaked at D3. (E) Flow cytometry analysis of injury-induced changes in monocytes/macrophage population. Compared to D0, there was a significant increase in CD45+CD11b+Ly6C+Ly6G- monocytes/macrophages in the knee joints after injury. Data is represented as mean ± standard deviation (SD). *p<0.01; ***p<0.0001; ****p<0.000001; ns, not significant (one-way ANOVA and Tukey’s post hoc test). (F) Safranin-O histological stained sections of uninjured and 4-weeks post-injury joints (4WKS PI). Arrow indicates cartilage damage observed at 4WKS PI. C, cartilage; B, bone; M, meniscus. 5× magnification; scale bars = 200μm.

