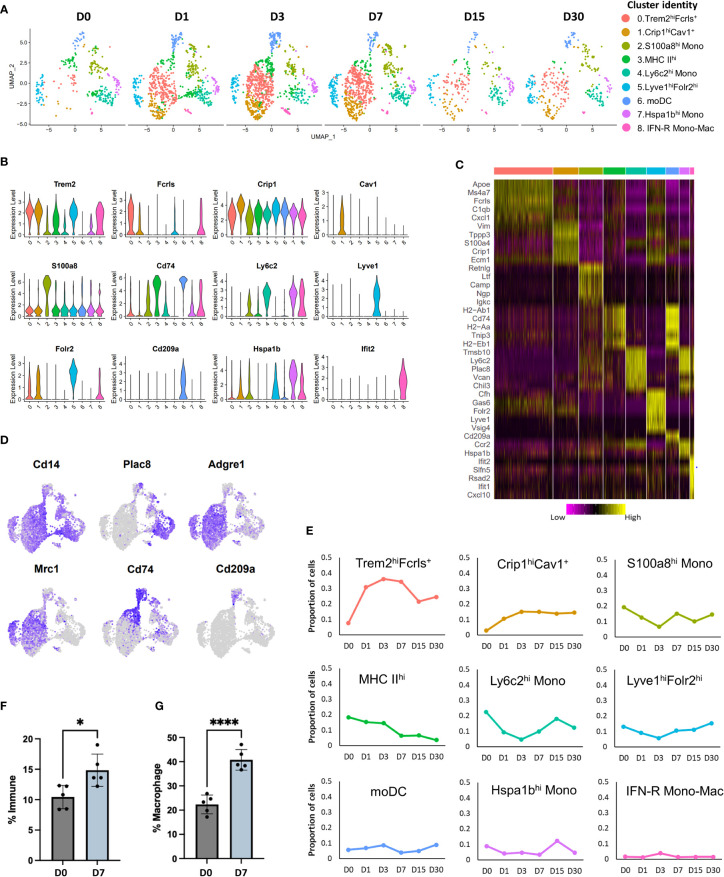
Figure 2.
Characterization of injury-induced changes in monocyte/macrophage populations. (A) UMAP plots of nine monocyte and macrophage subtypes identified in mouse knee joints at various timepoints. (B) Violin plots showing the expression of selected markers of various monocyte and macrophage sub-populations (colored based on cluster identities in panel (A). (C) Heatmap showing the scaled expression of top genes enriched in each monocyte/macrophage cluster. (D) Feature plots showing the expression of key monocyte and macrophage markers in various clusters. (E) Changes in the proportion of various monocyte and macrophage populations after injury, determined using scRNA-seq (colored based on cluster identities in panel (A). (F) Flow cytometry analysis of macrophages (CD45+CD11b+F4/80+) in uninjured (D0) and injured (D7) joints. Injured joints at D7 had significantly more macrophages than D0. Data is represented as mean ± SD. *p ≤ 0.05 (two-sided unpaired t-test). (G) Flow cytometry data showing the proportion of M2-like (CD45+CD11b+F4/80+ CD206+) macrophages at D0 and D7, relative to all macrophages. D7 joints showed a significantly higher proportion of M2-like macrophages compared to D0 joints. Data is represented as mean ± SD. ****p ≤ 0.0001 (two-sided unpaired t-test).

