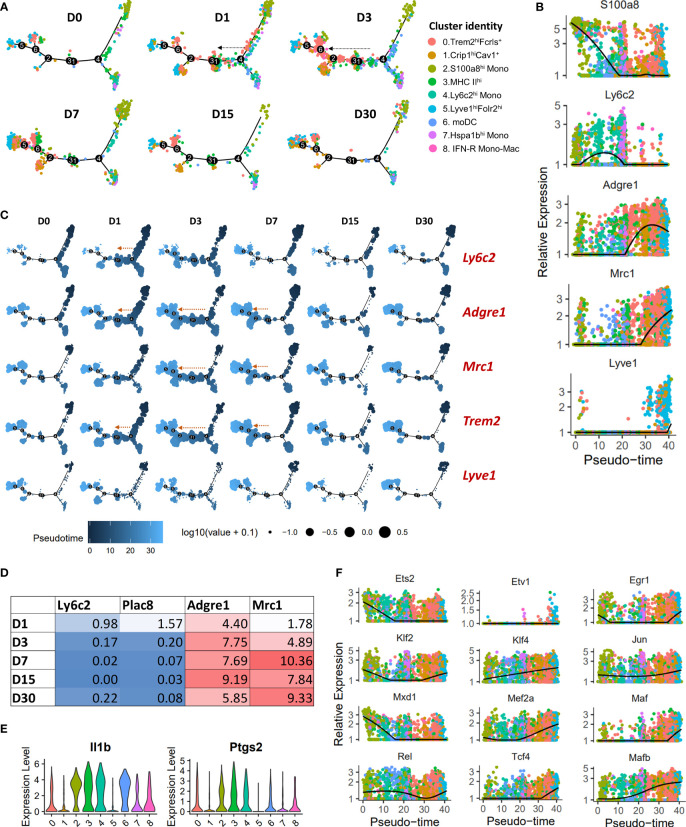
Figure 3.
Pseudo-time differentiation trajectory analysis of monocytes and macrophages from D0-D30. (A) The relative position of cells across the pseudo-time differentiation trajectory is depicted. Each point is a cell and is colored according to its cluster identity. Cells along the trajectory were divided into six groupings based on experimental timepoints (D0-D30). An expansion of Trem2hiFcrls+ population in monocytes → macrophage direction was observed after injury, primarily at D1 and D3 (indicated by arrows). (B) Expression of monocyte and macrophage markers on a pseudo-time scale (each point represents a cell and is colored based on cluster identities in panel (A)). Monocyte markers were highly expressed at the beginning of the differentiation trajectory while Mrc1 and Lyve1 had the highest expression towards the end. (C) Superimposition of the expression of selected genes on the pseudo-time trajectory. Each point is a cell and is colored according to its pseudo-time value. Circle size represents the gene expression level. Expansion of cell populations expressing high levels of Adgre1, Trem2 and Mrc1 in the monocyte → macrophage direction was observed after injury (indicated by arrows). (D) Average expression of monocyte and macrophage markers in Trem2hiFcrlshi cluster. (E) Violin plots showing elevated Il1b and Ptgs2 expression in MHC IIhi macrophages (cluster 3). MHC IIhi macrophages and monocytes/moDCs expressed higher levels of Il1b and Ptgs2 compared to other macrophage clusters, including Trem2hiFcrls+ and Lyve1+ macrophages. (F) Plots showing pseudo-time-ordered expression of selected transcription factors (cells are colored based on cluster identities in panel (A)).

