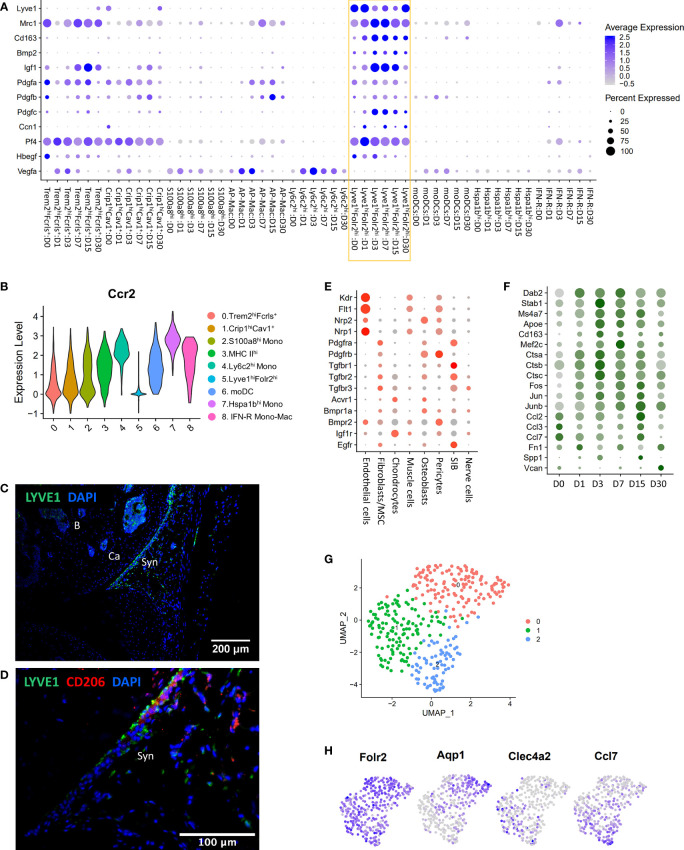
Figure 4.
Characterization of Lyve1hiFolr2hi macrophages. (A) Dot plot showing enrichment of growth factors in Lyve1hiFolr2hi macrophages (yellow box). Dot size represents the fraction of cells expressing a specific gene while the intensity of color indicates the average expression level for each gene. (B) Violin plot showing the expression of Ccr2 in various monocyte/macrophage subtypes. Lyve1+ macrophages showed significantly lower Ccr2 expression. (C) IHC analysis of Lyve1+ macrophages at D0 (10× magnification; scale bar = 200μm). Lyve1+ macrophages were primarily present at the synovial lining at D0. B: bone; Ca: cartilage; Syn: synovium. (D) Co-expression of Lyve1 and CD206 at the synovial lining at D0 (40× magnification; scale bar = 100μm). (E) Growth factor receptor expression in connective tissue-forming cells from the joint. Dot size represents the fraction of cells expressing each gene (grey: low expression; red: high expression). (F) Genes upregulated in Lyve1hiFolr2hi macrophages after injury. Dot size represents the fraction of cells expressing each gene (grey: low expression; green: high expression). (G) UMAP plot showing 3 subtypes of Lyve1hiFolr2hi macrophages. (H) Feature plots showing the expression of Folr2 and markers of various subtypes of Lyve1hiFolr2hi macrophages.

