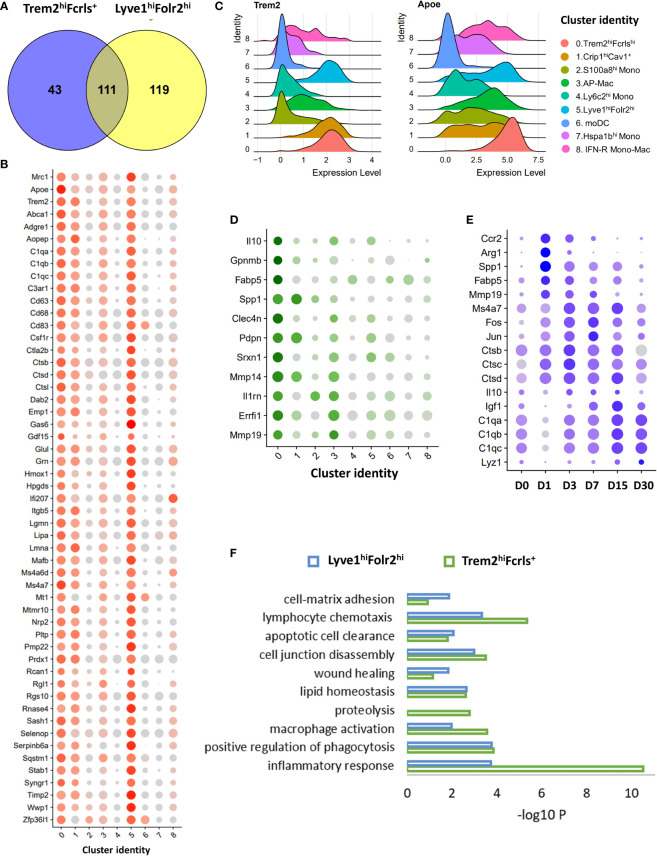
Figure 6.
Characterization of Trem2hi M2-like macrophages using scRNA-seq. (A) Venn diagrams showing the overlap between genes enriched in both Trem2hiFcrls+ and Lyve1hiFolr2himacrophages compared to all other clusters. (B) Dot plot showing the expression of a subset of genes enriched in both Trem2hiFcrls+ and Lyve1hiFolr2himacrophages. Dot size represents the fraction of cells expressing each gene (grey: low expression; red: high expression). (C) Ridge plot showing the expression of Trem2 and its ligand Apoe in various clusters. Both Trem2 and Apoe were enriched in Trem2hiFcrls+ and Lyve1hiFolr2hi macrophages. (D) Dot plot showing the expression of a subset of genes enriched in Trem2hiFcrls+ macrophages compared to Lyve1hiFolr2hi macrophages. Dot size represents the fraction of cells expressing each gene (grey: low expression; green: high expression) (E) Genes upregulated in Trem2hiFcrls+ macrophages after injury. Dot size represents the fraction of cells expressing each gene (grey: low expression; blue: high expression). (F) Ontology terms associated with genes enriched in Trem2hiFcrls+ and Lyve1hiFolr2himacrophages compared to other clusters.

