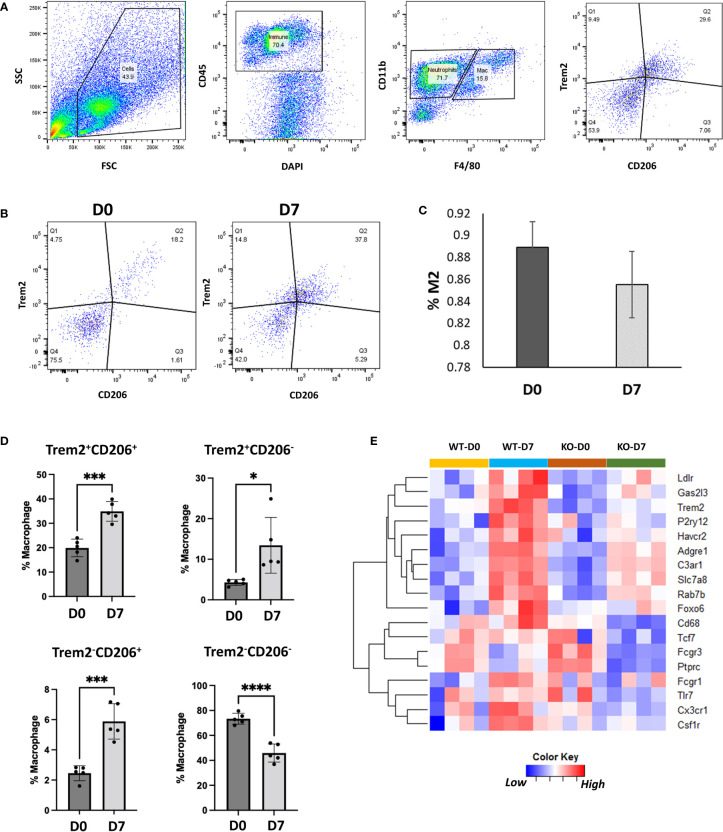
Figure 7.
Characterization of Trem2-expressing macrophages using flow cytometry. (A) Flow cytometry gating strategy to identify Trem2-expressing M2-like macrophages. (B) Flow cytometry plots showing Trem2+ M2-like macrophages at D0 and D7. (C) Proportion of Trem2+ macrophages among M2-like macrophages at D0 and D7. Data is represented as mean ± SD. (D) Proportion of Trem2 and CD206- expressing macrophages relative to all macrophages. Data is represented as mean ± SD. *p ≤ 0.05; ***p ≤ 0.001; ****p ≤ 0.0001 (two-sided unpaired t-test). (E) Genes differentially expressed between injured joints of wildtype (WT) and Trem2-/- (KO) mice at D7.

