Figure 8.
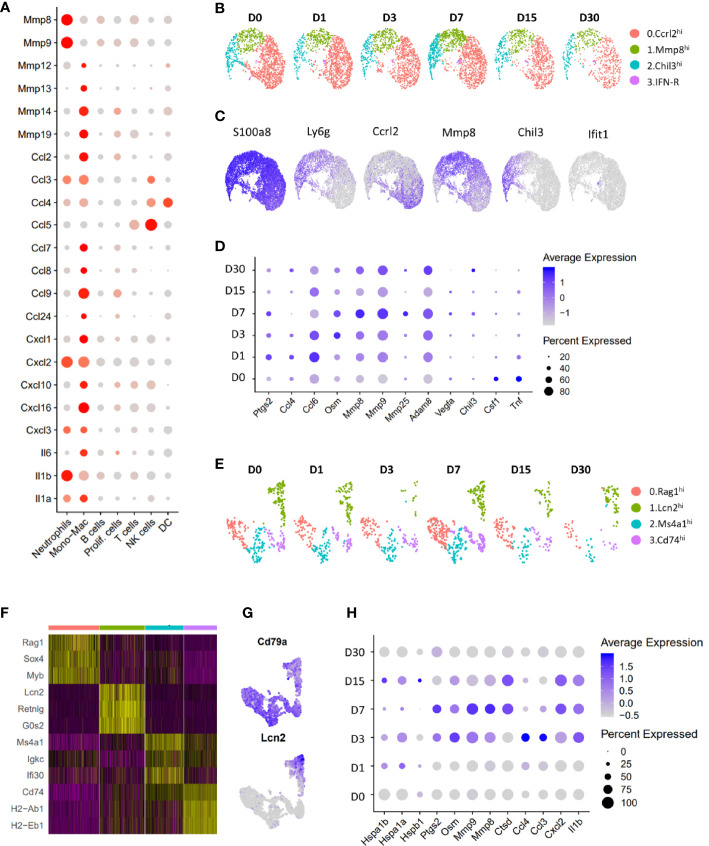
Characterization of neutrophils and B lymphocytes. (A) Dot plot showing the expression of cytokines and proteases in various immune cell clusters. Dot size represents the fraction of cells expressing a specific marker while the intensity of color indicates the average expression level for each gene (grey: low expression; red: high expression). (B) UMAP plot showing various neutrophil sub-clusters. (C) Feature plot showing the expression of various neutrophil sub-cluster markers as well as pan-neutrophil marker S100a8. (D) Dot plot showing genes differentially expressed in neutrophils after injury. Dot size represents the fraction of cells expressing a specific marker while the intensity of color indicates the average expression level for each gene. (E) UMAP plot showing various B cell sub-clusters. (F) Heatmap showing genes enriched in each B cell subtype. (G) Feature plot showing the expression of Lcn2 and B cell marker Cd79a in B cell subtypes. (H) Genes differentially expressed in Lcn2hi B cell-like cells after injury. Dot size represents the fraction of cells expressing a specific marker while the intensity of color indicates the average expression level for each gene.

