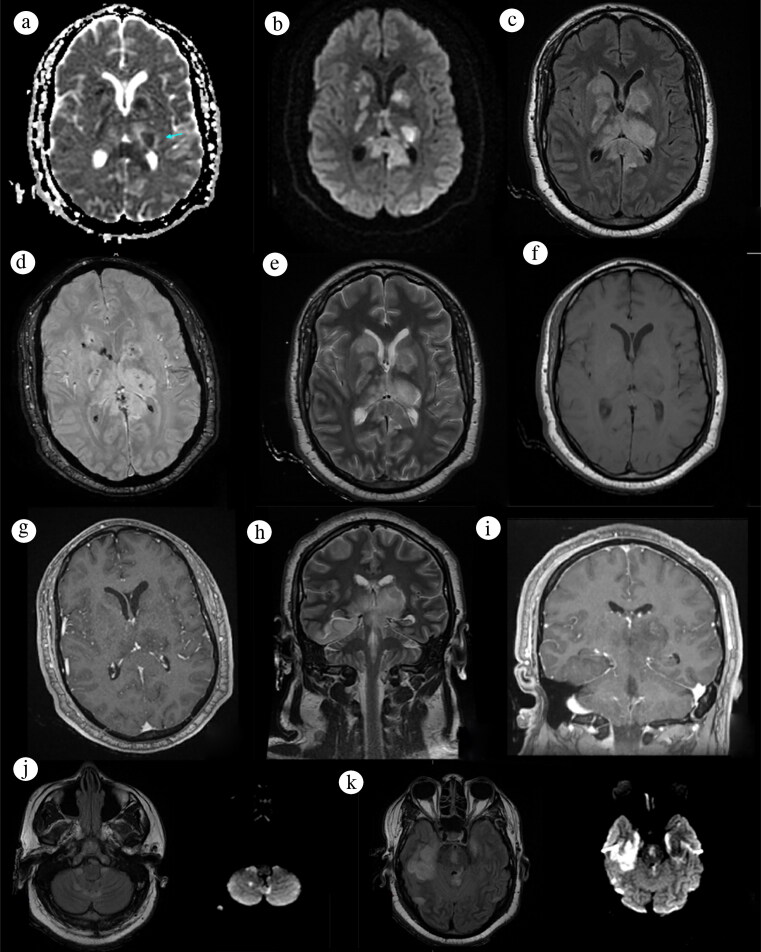
Figure 2.
MRI brain in an axial view at the level of the basal ganglia on (a) ADC, (b) DWI, (c) FLAIR, (d) SWAN, (e) T2, (f) T1, and (g) T1 contrast. A coronal view shows other affected areas on (h) T2 and (i) contrast. A trilaminar pattern (blue arrow) of the thalamus in (a) ADC can be seen with a central high ADC value and a middle low ADC value, suggesting cytotoxic edema with peripheral high ADC suggesting vasogenic edema, with (b) diffusion restriction on these areas. Symmetrical (c) FLAIR hyperintense lesions are also seen on the basal ganglia. Hypointense lesions on (d) SWAN represented hemorrhages. (j, k) FLAIR hyperintense lesions with diffusion restriction on DWI were detected on the cerebellar, brainstem, and temporal region.

