Figure 2.

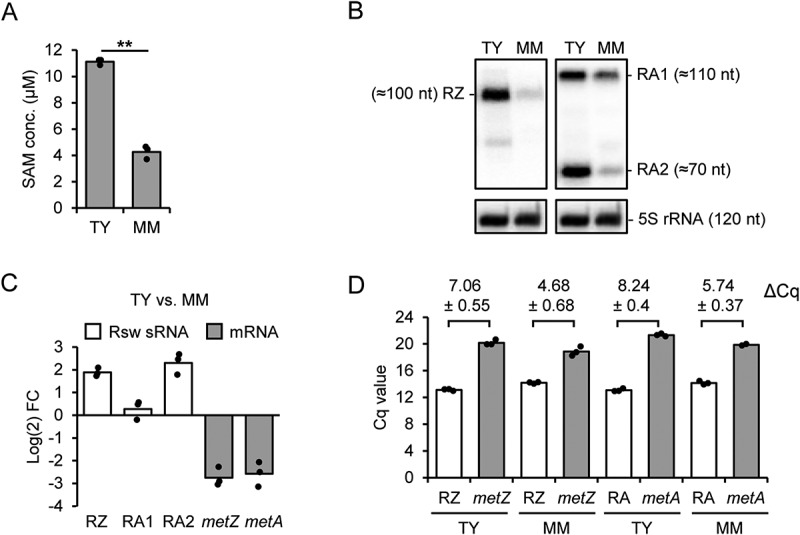
Analysis of SAM levels and RNA steady state amounts in S. meliloti 2011 cultures grown in TY and MM. A) SAM concentration in cell lysates. B) Northern blot hybridization of total RNA separated in denaturing 10% polyacrylamide (PAA) gel with probes directed against the metZ and metA riboswitch aptamer (see Fig. S3). The membrane was first hybridized with the probe detecting the RZ sRNA and then rehybridized with the probe detecting RA1 and RA2 sRNAs (compare to Figure 1A). To determine the sRNA lengths, the membrane was then hybridized sequentially with probes detecting tRNAThr (86 nt), 6S RNA (156 nt) and 5S rRNA (120 nt). The latter is also shown as loading control. C) Comparison of the sRNA and mRNA levels in TY and MM cultures shown as log2 fold change (FC). The sRNA levels were determined by Northern hybridization and the mRNA levels by qRT-PCR analysis. TRIzol-purified total RNA was used. D) Cq values of the qRT-PCR analysis conducted with primers detecting the indicated mRNAs and sRNAs (see Figure 1A; the sRNA-detecting primers target also the 5’-UTR of the corresponding mRNA; RA: RA1 + RA2). Hot phenol-purified total RNA was used. Comparison of results obtained with TRIzol- and hot phenol-purified RNA is shown in Fig. S4. Differences in the Cq values are given (means and s. d.), which indicate much higher abundance of the sRNAs in comparison to the mRNAs. All graphs show means and single data points of three independent experiments.
