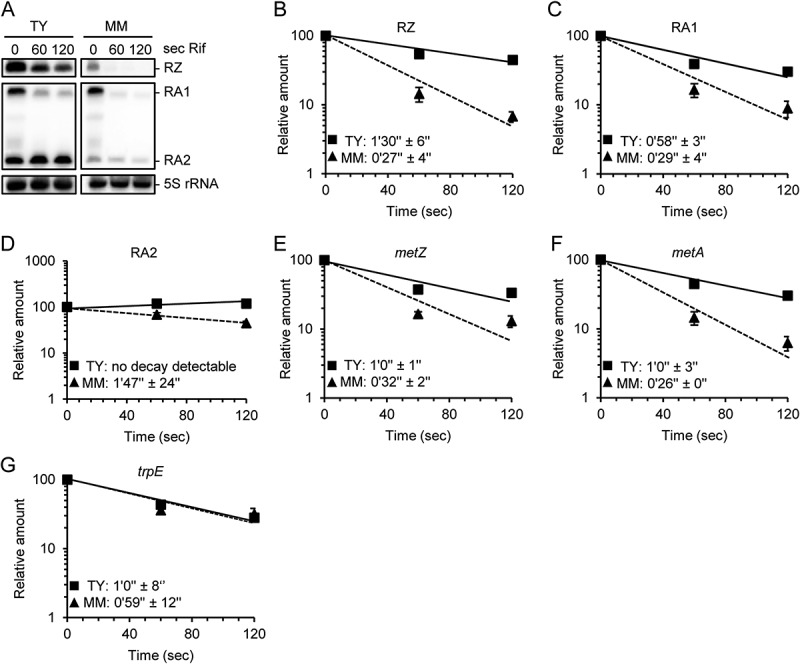
Figure 3.

Higher stabilities of metZ and metA mRNAs and of riboswitch sRNAs in TY than in MM. A) Northern blot hybridization of total RNA separated in denaturing 10% PAA gel. Probes detecting the indicated sRNAs were used. Time (in seconds) after addition of rifampicin (Rif), at which the RNA was isolated, and the used media are indicated. B) to G) Graphs showing the half-lives of the indicated sRNAs and mRNAs in TY and MM. Relative RNA amounts were plotted against the time after Rif addition. The RNA amount at time point 0 was set to 100%. Squares and solid line: RNA from TY cultures. Triangles and dashed line: RNA from MM cultures. All graphs show means and standard deviations (s.d.) of two independent experiments. In some cases, the s.d. is smaller than the symbol.
