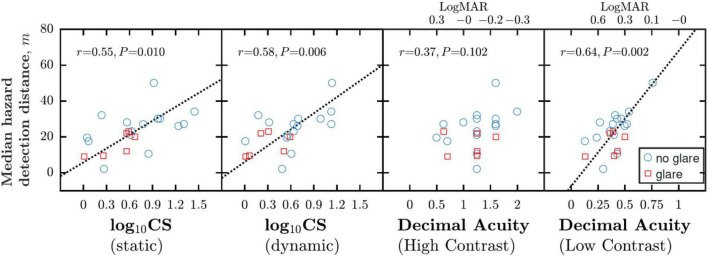
FIGURE 2.
Correlations between night driving performance, as measured by MHDD, and various measures of CS (measured within the simulator) and VA (measured outside the simulator). Each marker indicates data from a single participant, with measurements made either with glare (red squares) or without glare (blue circles). Dashed lines show best fitting geometric mean (“error in both axes”) regression slopes.

