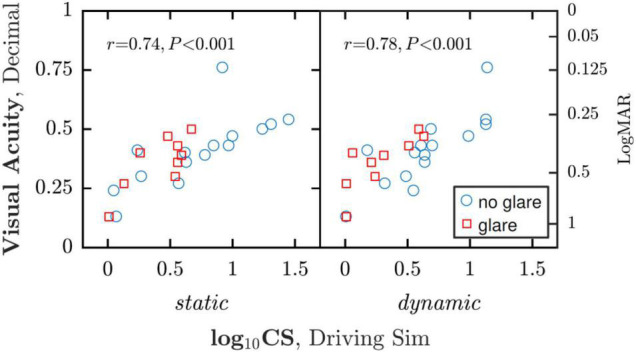
FIGURE 3.

Correlations between CS (measured within the simulator) and low contrast VA (measured outside the simulator). Note that each participant contributed two data points to each analysis, and as such a more statistically correct approach would have been to use a linear mixed effects model to account for any dependencies between within-subject data points.
