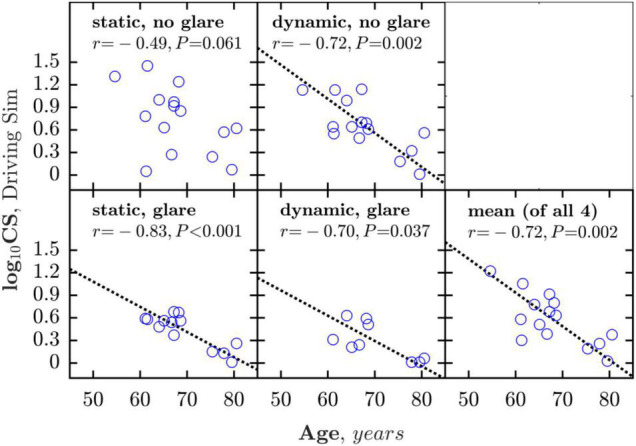
FIGURE 6.

Correlations between age and CS measured under the four simulator conditions (glare/no-glare vs. static/dynamic). The bottom right panel shows mean CS averaged across all four measures. Dashed line shows geometric mean regression slope (shown only where association was statistically significant).
