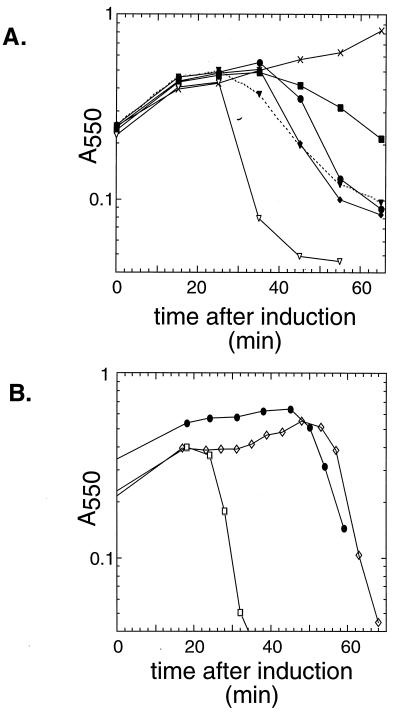
FIG. 5.
Lysis profiles for induced lysogens with C-terminal alterations in S. (A) Lysogens of λb515 b519 Tn903 cI857 nin5 S105 carrying S alleles with different C-terminal amber mutations were thermally induced in logarithmic phase and monitored for lysis by measuring the A550. Representative lysis profiles are shown for all alleles, including two profiles showing the variability of the K97am lysis kinetics. Symbols: ●, parental (no truncation); ■, D103am; ⧫, E102am; ▿ and ▾, K97am; ×, K92am. (B) Lysogens of λkan (●) and the isogenic phages λbj1 (SA52G [□]) and λaj1 (plaque-forming revertant of λbj1 [◊]) were thermally induced and monitored as in panel A.

