Figure 1.
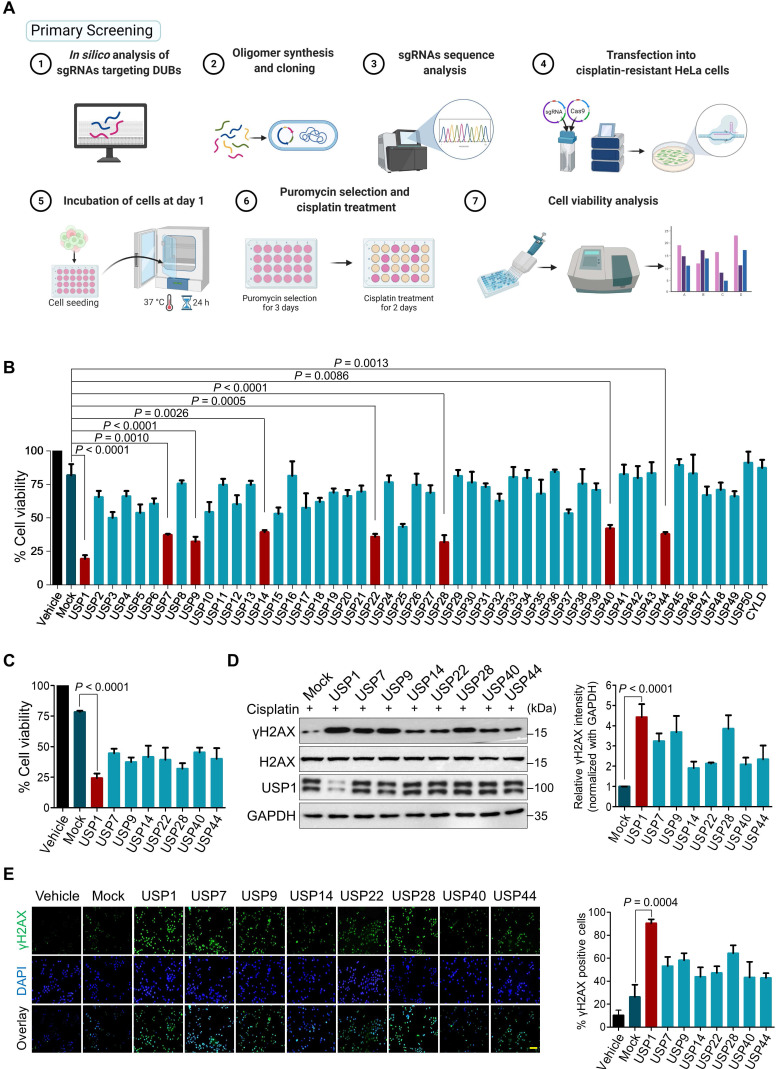
CRISPR/Cas9-based genome-scale screening of USP subfamily proteins showing drug resistance to cisplatin treatment. (A) Schematic illustration of primary screening using CRISPR/Cas9-based DUB knockout screening system and cisplatin treatment. Step 1: In silico analysis to design sgRNAs targeting entire USP subfamily genes with high cleavage efficiency and low off-target scores. Steps 2-3: sgRNA synthesis and cloning into U6 promoter-driven plasmid followed by sequence analysis. Steps 4-5: The sgRNA library targeting an entire set of genes encoding USPs was co-transfected with Cas9 into HeLa-cisR cells and incubated for 24 h (day 1). Step 6: sgRNA-transfected cells were selected by puromycin (2 µg/mL) for 3 days (days 2-5). On day 9, the puromycin-selected HeLa-cisR cells were re-seeded into 96-well plates at a density of 10,000 cells/well. The cells were cultured in vehicle or a sub-lethal dose of cisplatin for 48 h (days 10-12). Step 7: Cells were subjected to the cell viability assay using a CCK-8 kit. (B) The cisplatin-induced cell death from (A) was estimated using a cell viability assay and plotted as a bar graph. Vehicle-treated HeLa-cisR cells served as the negative control, and cisplatin-treated HeLa-cisR cells co-transfected with scrambled sgRNA and Cas9 served as the mock control. Data are presented as the mean and standard deviation of three independent experiments (n = 3). One-way ANOVA followed by Tukey's post hoc test was used with the indicated P values. (C) Cell viability of the putative DUB candidates. Data are presented as the mean and standard deviation of three independent experiments (n = 3). One-way ANOVA followed by Tukey's post hoc test was used with the indicated P values. (D) The HeLa-cisR cells were transfected with sgRNAs targeting the putative candidates and then exposed to a sub-lethal dose of cisplatin to assess the cisplatin-induced DNA damage using γH2AX antibodies. H2AX and GAPDH were used as loading controls. The relative expression of γH2AX was quantified with ImageJ software (right panel). Data are presented as the mean and standard deviation of three independent experiments (n = 3). One-way ANOVA followed by Tukey's post hoc test was used with the indicated P values. (E) Immunofluorescence staining showing γH2AX expression in HeLa-cisR cells transfected with sgRNAs targeting the indicated DUB candidates and exposed to vehicle or cisplatin. γH2AX-positive cells were quantified, and the results are represented as a bar graph (right panel). Data are presented as the mean and standard deviation of three independent experiments (n = 3). One-way ANOVA followed by Tukey's post hoc test was used with the indicated P values. Scale bar = 100 µm.

